Sandbox
Sandbox gives customers the ability to interactively compare graphs across different nodes, in a single pane of glass.
Each graph can be customized to any server, device or even Monitoring Group.
Sandbox is perfect for big-screen TV monitors, where customers can keep an eye on the most critical metrics on any server or device side-by-side.
All graphs are fully interactive and customizable, with support for zooming and automatic scaling features.
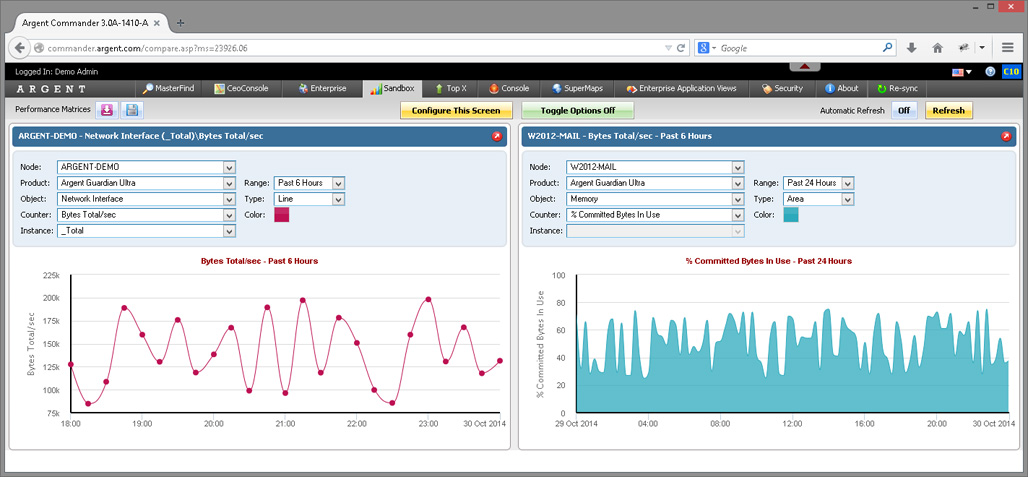
Up to 10 graphs can be placed onto a single page, configurable from the ‘Configure This Screen’ button
Additionally, the ‘Toggle Options Off’ feature hides the pull-down menus to save on screen real-estate
Like other tabs, the Sandbox tab benefits from Security settings, Performance Matrices to save ‘views’, and per-user persistent settings
By default, all users will be granted access to the new Sandbox tab – to remove this feature, uncheck the ‘View Sandbox Tab’ Right in the Security settings for the selected users or groups