Alert Tables
Alert Tables display data related to Argent Alerts
Moreover, Alert Tables can have Filters and can be used to display data only if a certain number of lines match the criteria
Important Note: The first and second columns of an Alert Table are reserved for the Date/Time and Node Name
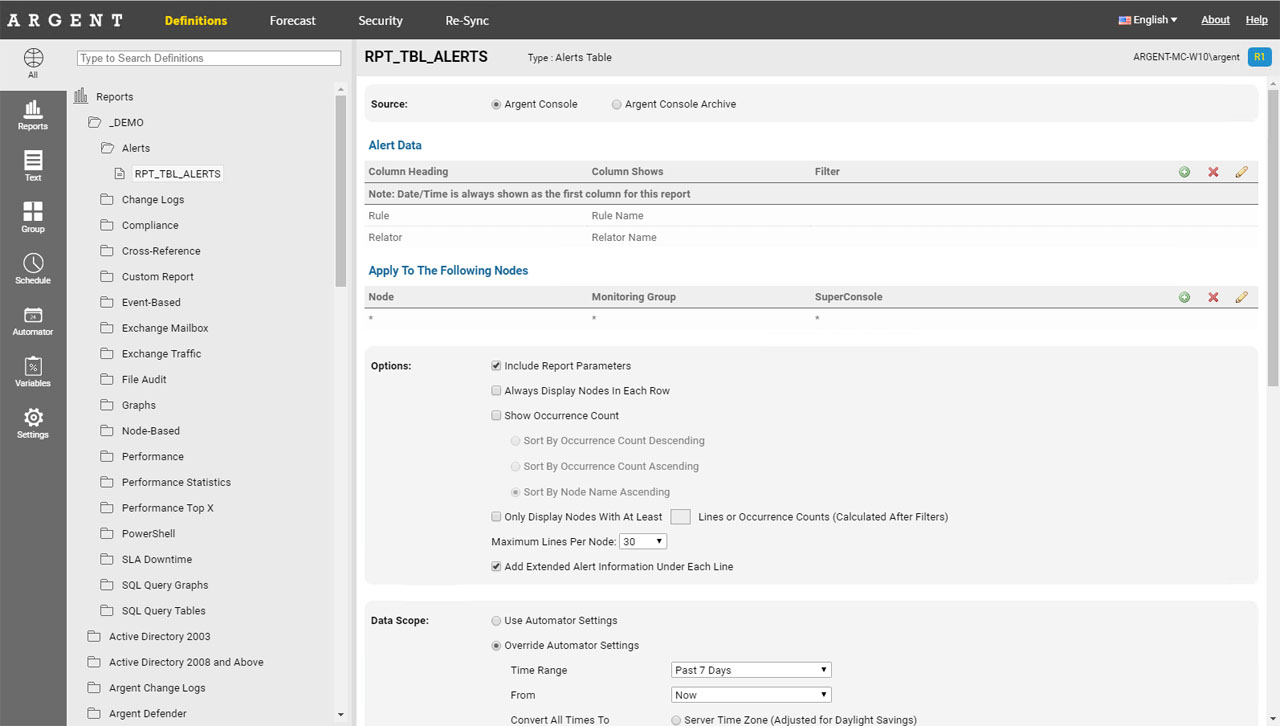
Alert Data
The Alert Data section is used to define what will be displayed in what column
You can drag-and-drop to change the order of the columns
Alert Data has a finite set of fields to read from, namely:
- Alert Priority
- Alert Time
- Console Comment
- Detailed Status
- Event Time
- Last Modifed By
- Last Modifed Time
- Product Name
- Relator Name
- Rule Category
- Rule Name
- Seconds To Resolution
- Status
Show Occurrence Count
If you prefer listing out the occurrence counts of, say, all Alerts for the Rule PRF_CPU_BUSY, instead of listing them out individually, then simply check this box
When this box is checked, the layout of the table changes, and some options, such as adding the Memo Notes, are disabled (no longer applicable)
Additionally, when this box is checked, the Maximum Lines Per Node option changes to “Show Top X Entries” so that Top X Reports can be created
You can also choose the sort order when this option is checked
Only Display Nodes With At Least X Lines Or Occurrence Count (Calculated After Filters)
When applying a Report to an entire Monitoring Group, you may come across servers that don’t have the data, or don’t have data that match the filters.
Instead of displaying masses of empty tables that say “No data could be found…”, you can simply not display a table for a node if it doesn’t have at least X number of lines
Maximum Lines Per Node
For Event-Based tables, there is a maximum line count
Unlike Performance tables, where data is aggregated into time buckets (and thus has a finite and controlled number of lines), alerts are a completely different beast and cannot be aggregated
For instance, if a few of your servers each have thousands of Alerts in the past week, and if you’re running the data against a Monitoring Group of 1,000 servers — the time taken to fetch the data for every node, write and produce the PDF, would take an inordinate amount of time — not to mention the PDF could have 10,000+ pages
Thus, Argent has set a limit of 100 lines — that is maximum number of lines that will be displayed per node for the specified Report Definition
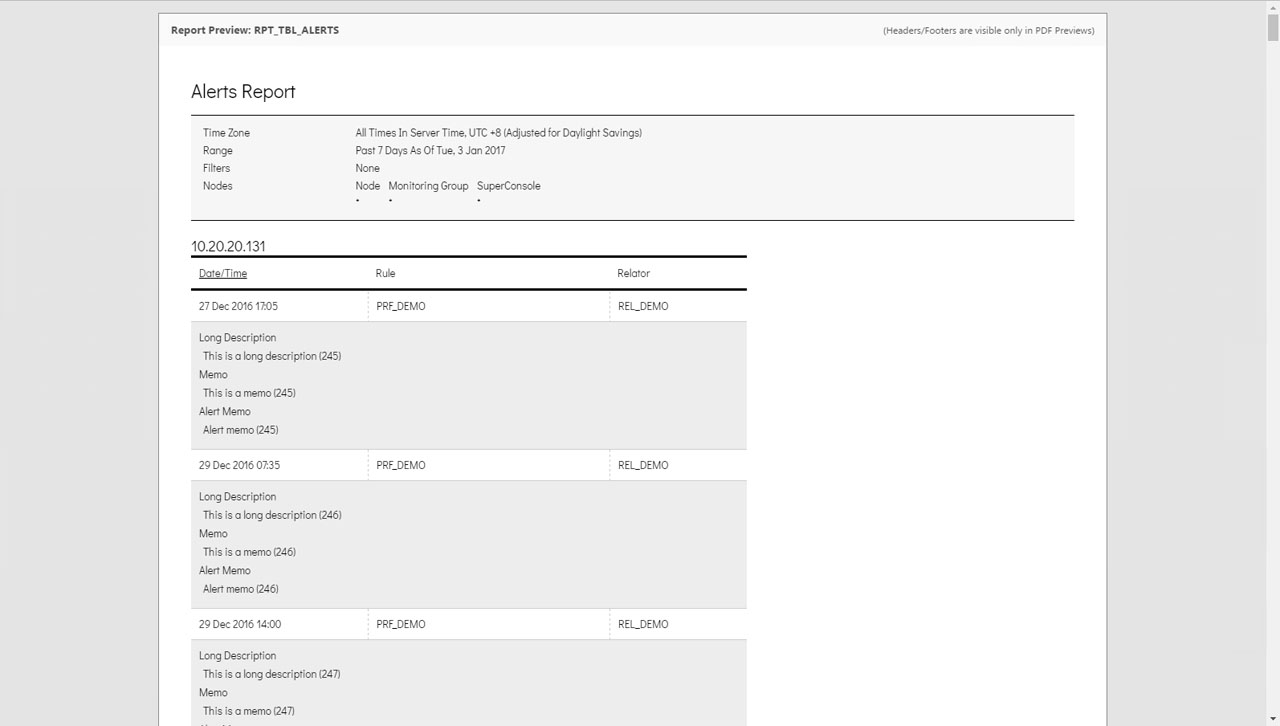
Argent will always show the latest or most recent X lines
To prevent confusion for the recipient, there will also be a label next to the node specifying the displayed line count and the total lines that exist
Let’s say, for a particular server called ARGENT-SVR1, we have 42,580 Event ID 529’s
We want to show the latest 30 lines for a table only
The table would be headed with: ARGENT-SVR1 (Showing Last 30 of 42,580 Lines)
Show Top X Entries
This option only appears when “Show Occurrence Count” is checked
This option lists out only the Top X Entries
Add Extended Alert Information Under Each Line
The extended Alert information includes Memo Notes, a long description, and the Alert Memo