SLA Downtime Tables
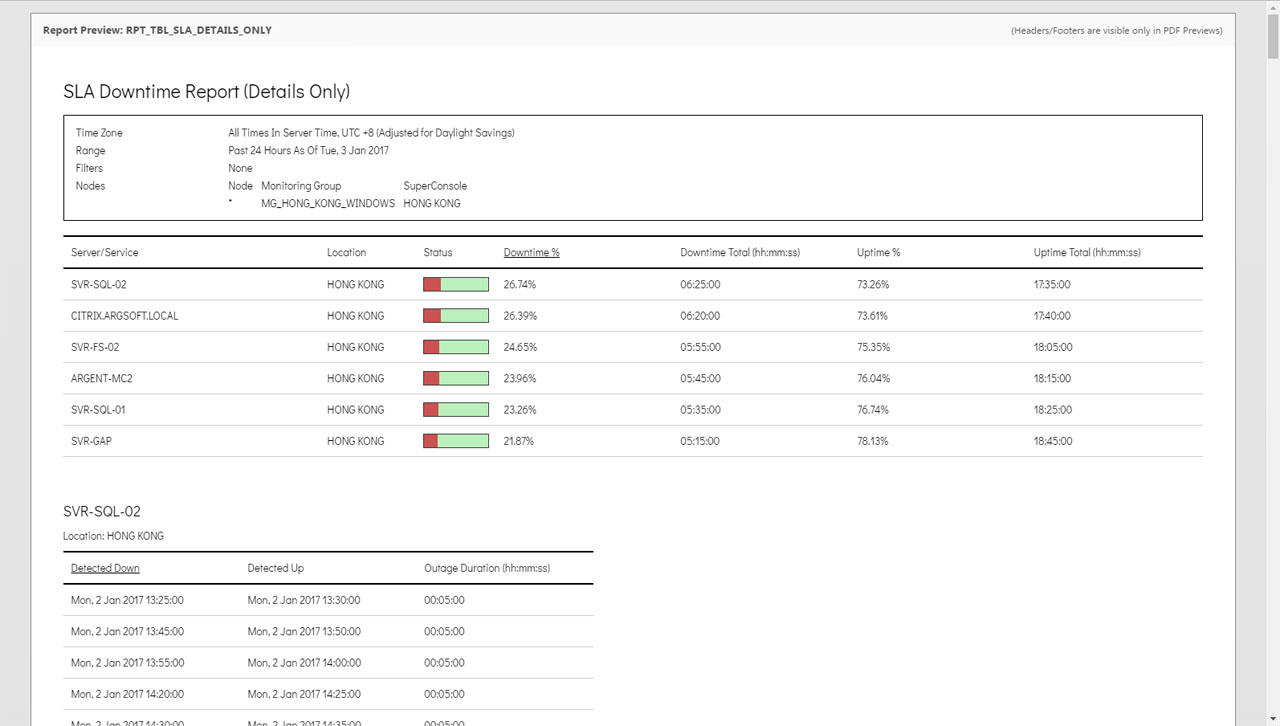
SLA Downtime Tables allow you to plot a table of all outages throughout a time period, and calculate the total outage time, % uptime and % downtime.
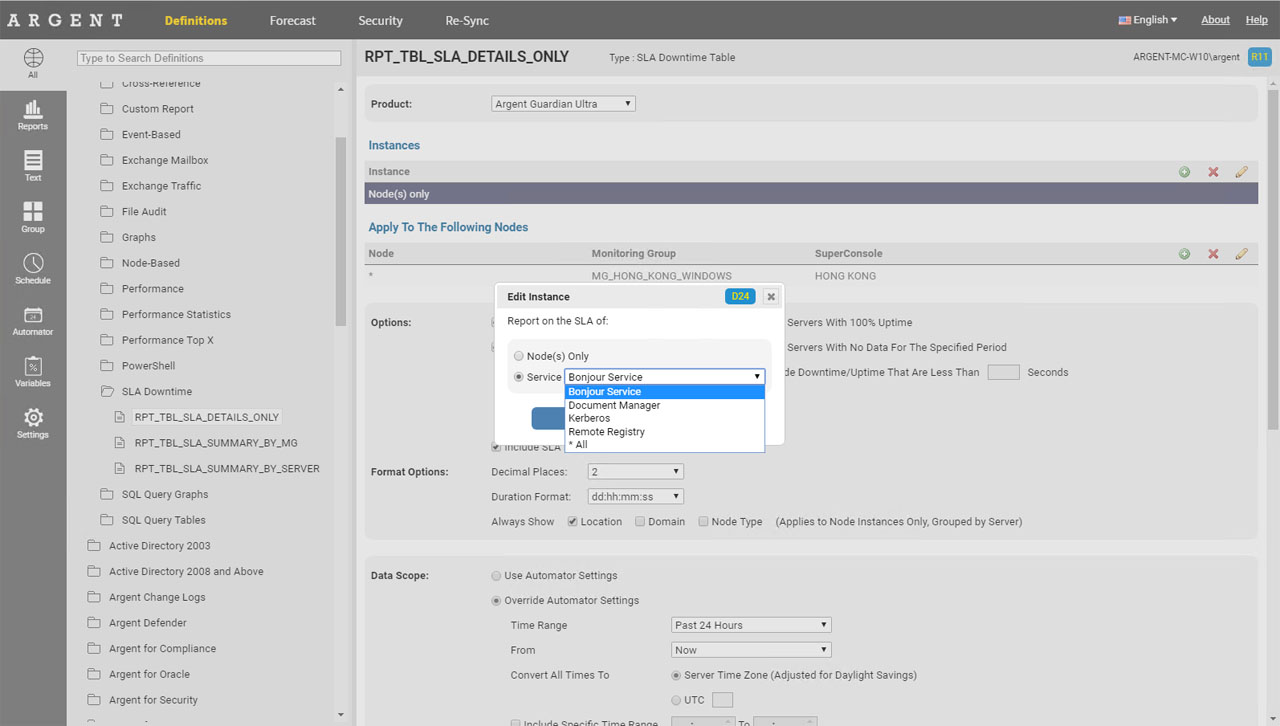
Instances
SLA data can be plotted for Nodes, or for “instances” of a Node – e.g. data collected from Windows Service Rules to generate Windows Service Uptime SLA Reports:
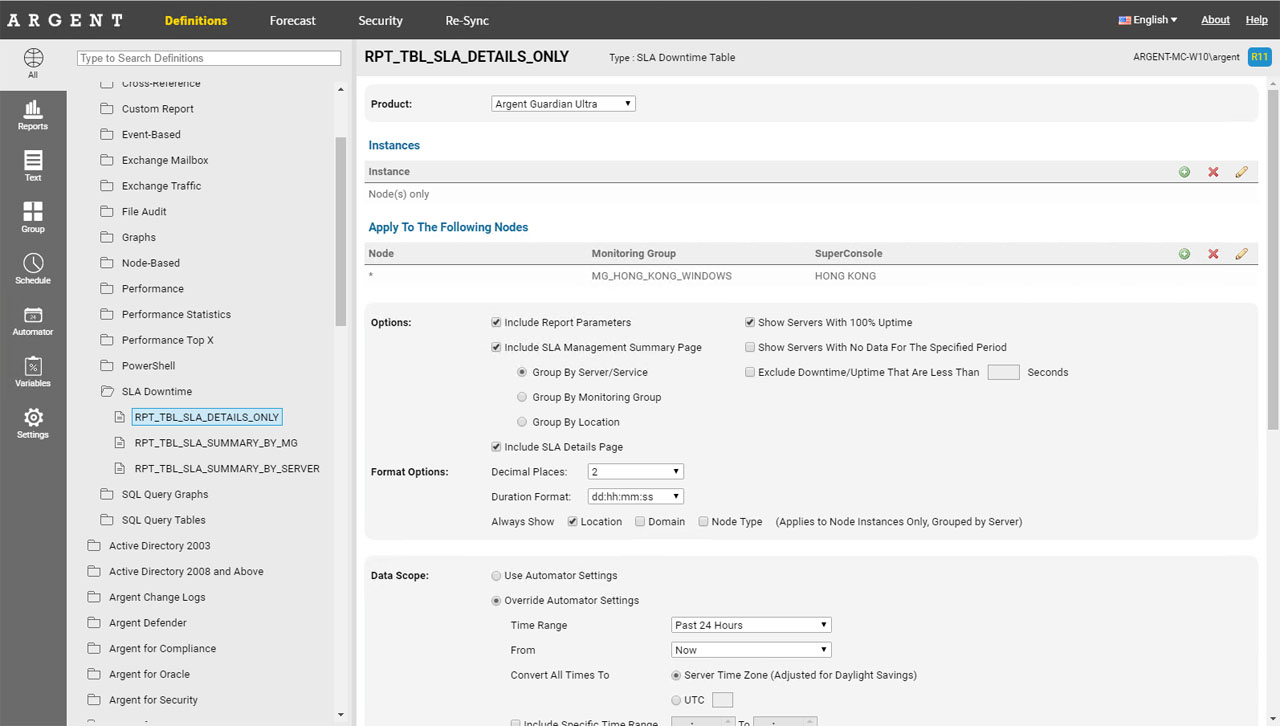
Options
You can choose to Exclude outages that are less than a certain number of seconds — these may simply be blips in the network that you want to filter out
Include SLA Management Summary Page
Includes a summary page of total uptime, downtime, and visualization bars for each node, location, or Monitoring Group
The various grouping options controls whether SLA should be grouped by individual node, location or Monitoring Groups
Include SLA Details Page
Includes a detailed SLA breakdown of all the downtime or outage events, including when the node was detected up, down, and each outage duration.
Show Servers with 100% Uptime
Some customers are only interested in seeing servers that have some sort of downtime – so unchecking this option would omit servers with 100% uptime.
Show Servers with No Data For The Specific Period
Some customers are only interested in seeing servers that have data – if a specific server was NOT monitored or had no data, it would only show up in the report if this box is checked
Exclude Uptime/Downtime That Are Less Than X Seconds
Useful for weeding out minor outages from the report, e.g. a five-minute outage. This option would simply treat it as if the downtime/uptime didn’t exist.
Note that SLA Reports honor Argent AT’s Maintenance Mode for nodes – for servers that recorded SLA downtime during Maintenance periods, the SLA is treated as “up” instead.