Argent Dashboard
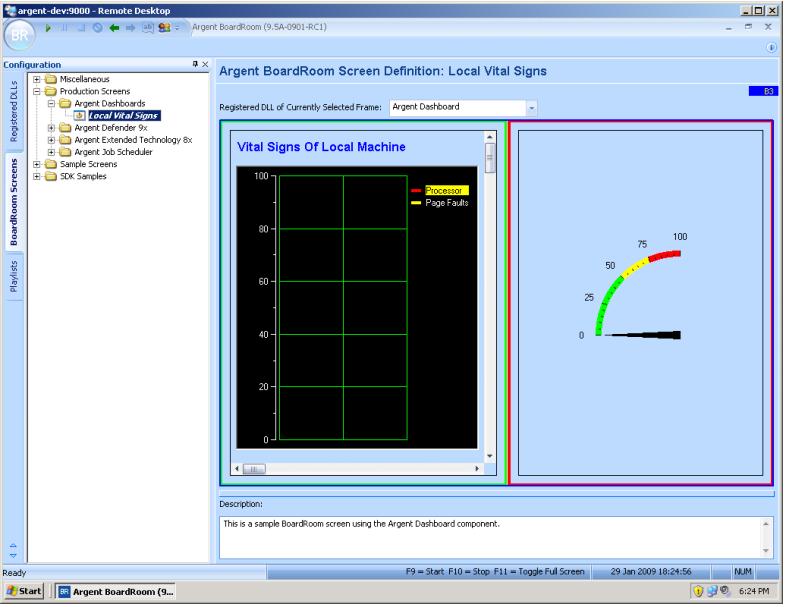
The Argent BoardRoom also comes with a sample dashboard screen, called Local Vital Signs.
The Argent Dashboard does real-time performance tracking from multiple data sources.
These include Windows performance counters, ODBC, SNMP, File and External Programs.
This facility enables customers to display graphical output in minutes from an unlimited array of data sources. |
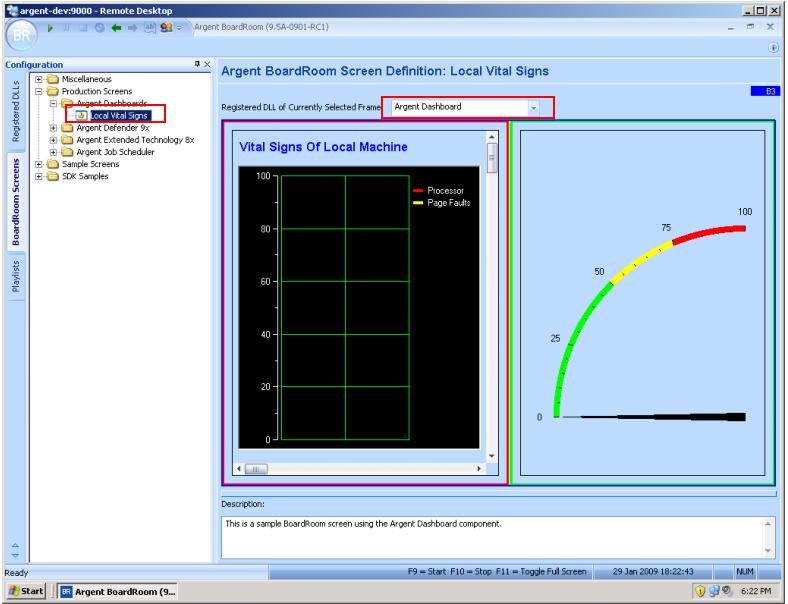
To configure a dashboard, right-click on the frame and select Design Currently Selected Frame.
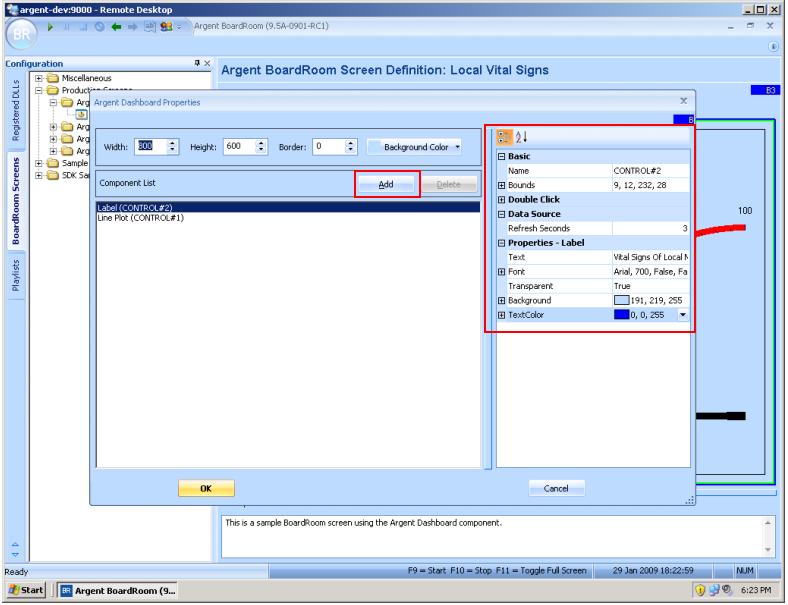
To add a new dashboard component, click on the Add button on the left pane.
To modify an existing dashboard component, change the properties on the right pane.
Positioning
There are two methods of positioning components.
The first method is to use the Bounds property, where the X and Y co-ordinates (0,0 is the top-left corner) are required.
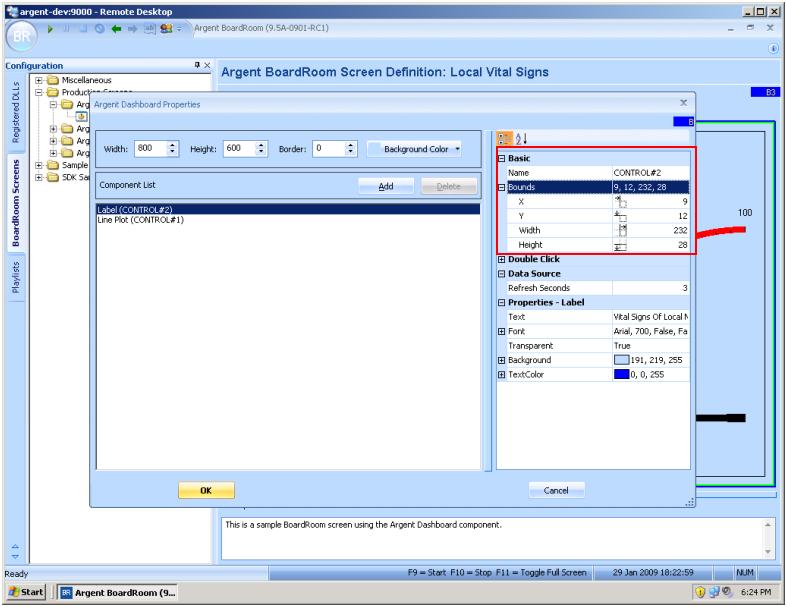
The second method of positioning is to hold down the CTRL key and drag the component.
As the component is dragged, you will see a dotted outline to mark its position.
Similarly, you can hold down the SHIFT key to resize a component.
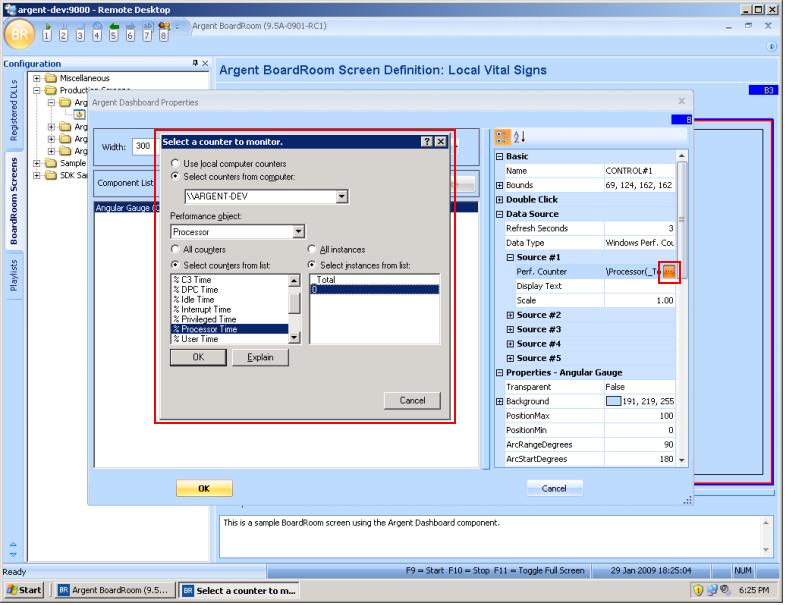
To change the performance counter to track, specify the Data Type under Data Source as Windows Perf. Counter (there will be a pull-down menu). This creates a Source #1 sub-tree.
Click on the browse icon next to Perf. Counter.
This causes the performance counter selection dialog to appear — just like the Windows PERFMON utility: