Event-Based Tables
Event-Based Tables display data related to events — typically Windows Event Logs, SNMP Traps, ASCII Logs, etc.
Important Note: The first and second columns of an Event Table are reserved for the Date/Time and Node Name
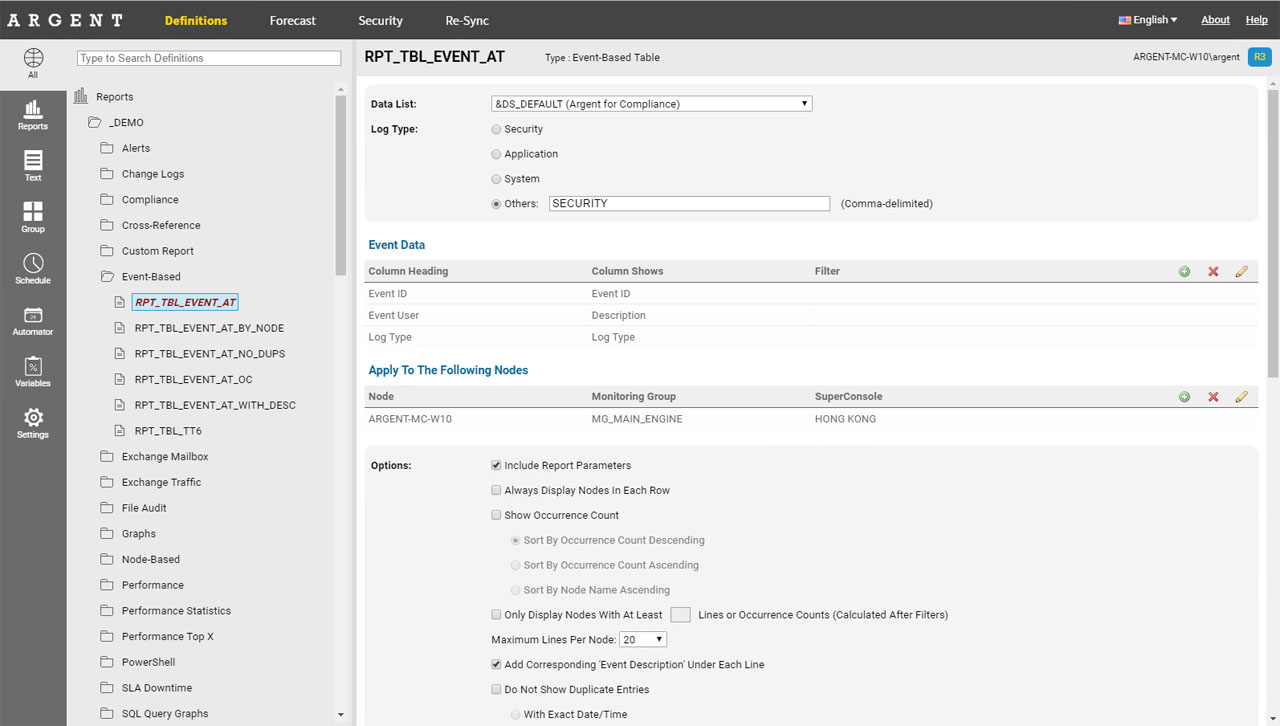
Event Data
The Event Data section is used to define what will be displayed in what column
You can drag-and-drop to change the order of the columns
Event Data has a finite set of fields to read from, namely:
- CATEGORY
- DESCRIPTION
- EVENT_ID
- EVENT_USER
- LOG_TYPE
- SEVERITY
- SOURCE
- USER_DATA_1 to USER_DATA_10
These fields correspond to the database fields seen in the Archived Logs SQL tables in Argent for Compliance or Argent for Security
Refer to the data in the Archived Logs SQL table to see how each of the different fields are represented in order to create a report that meets your needs
Filters
One of the main differences between Argent Tables and Argent Graphs are the inclusion of Filters
Filters are located on the second “tab” in the Event Data popup
Filters are always done with an implicit AND operation with other columns
For example, let’s say we have the following data:
If we had a filter on Event ID = 529
And
If we had a filter on Event User = John.Doe
We would end up with just one line from the example above:
It is the only line that matches Event ID = 529 AND Event User = John.Doe
Columns can also be set to ‘Do Not Display The Column, Only Use It As A Filter’ — this allows the column to be used a filter without displaying it
Data List
Data Lists are a type of definition in Argent for Compliance or Argent for Security, as a method of defining the location of where data is stored
For instance, a Data List would tell us the database type, database server, database name, and the table where data is stored
The available Data Lists are automatically populated for you
Show Occurrence Count
If you prefer listing out the occurrence counts of, say, all Event 529s instead of listing them out individually, then simply check this box
When this box is checked, the layout of the table changes, and some options, such as Maximum Lines Per Node or adding the Event Description, are disabled (no longer applicable)
Additionally, when this box is checked, the Maximum Lines Per Node option changes to “Show Top X Entries” so that Top X Reports can be created
You can also choose the sort order when this option is checked
Only Display Nodes With At Least X Lines Or Occurrence Count (Calculated After Filters)
When applying a Report to an entire Monitoring Group, you may come across servers that don’t have the data, or don’t have data that match the filters.
Instead of displaying masses of empty tables that say “No data could be found…”, you can simply not display a table for a node if it doesn’t have at least X number of lines
Maximum Lines Per Node
For Event-Based tables, there is a maximum line count
Unlike Performance tables, where data is aggregated into time buckets (and thus has a finite and controlled number of lines), events are a completely different beast and cannot be aggregated
For instance, if a few of your servers each have 50,000 Event ID 529s in the past week, and if you’re running the data against a Monitoring Group of 1,000 servers — the time taken to fetch the data for every node, write and produce the PDF, would take an inordinate amount of time — not to mention the PDF could have 10,000+ pages
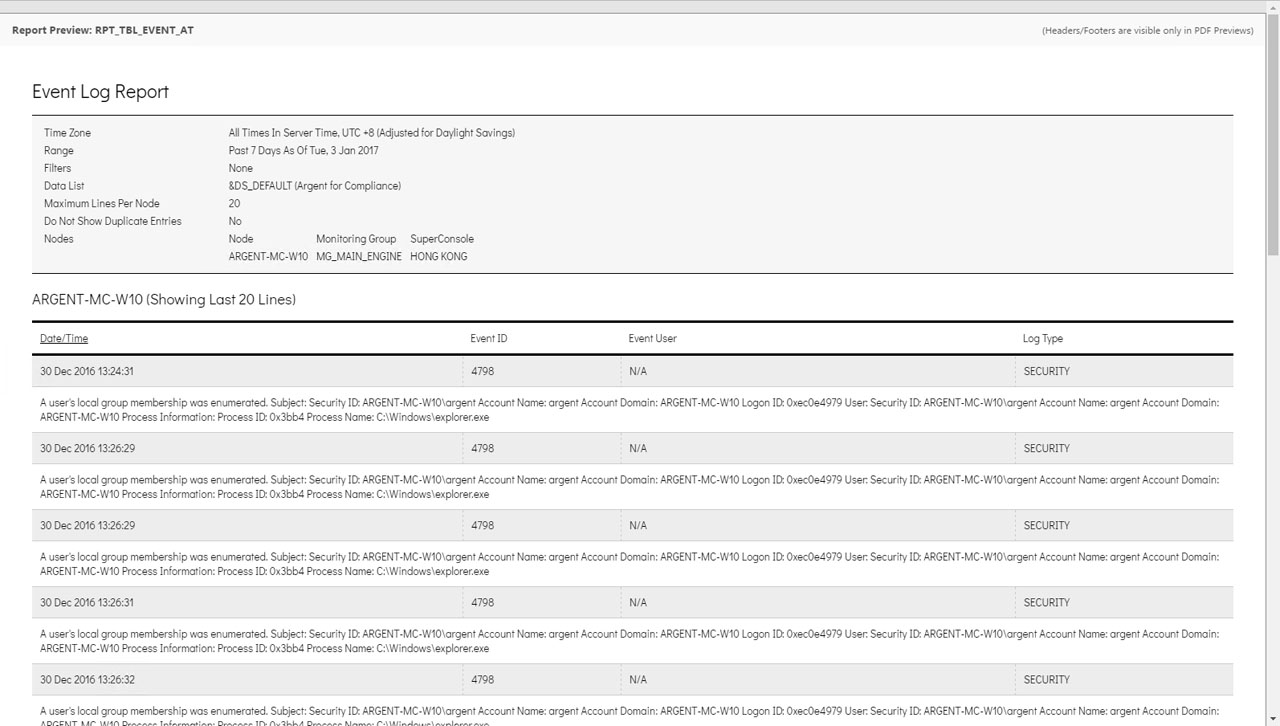
Thus, Argent has set a limit of 100 lines — that is maximum number of lines that will be displayed per node for the specified Report Definition
Argent will always show the latest or most recent X lines
To prevent confusion for the recipient, there will also be a label next to the node specifying the displayed line count and the total lines that exist
Let’s say, for a particular server called ARGENT-SVR1, we have 42,580 Event ID 529’s
We want to show the latest 30 lines for a table only
The table would be headed with: ARGENT-SVR1 (Showing Last 30 of 42,580 Lines)
Show Top X Entries
This option only appears when “Show Occurrence Count” is checked
This option lists out only the Top X Entries
Add Corresponding ‘Event Description’ Under Each Line
The Event Description or event body will be added under each line
Do Not Show Duplicate Entries
Sometimes, Windows servers will write duplicate event entries with the exact same timestamp, event ID, source, description, etc.
This checkbox will ignore these exact duplicates when performing occurrence counts or listing event entries.
There are two options:
- With The Exact Date/Time (weeds out duplicates with the exact date/time)
- With The Exact Date (weeds out duplicates only with the exact date, ignoring the time portion