Creating A New View
Creating a new ViewMagic View is simple and straightforward — here’s a step-by-step guide to creating a simple View.
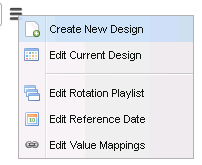
- Click on the Options Icon and choose Create New Design
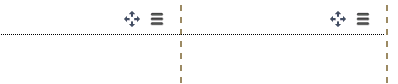
- Starting off with a brand new View, a single Pane will be shown:
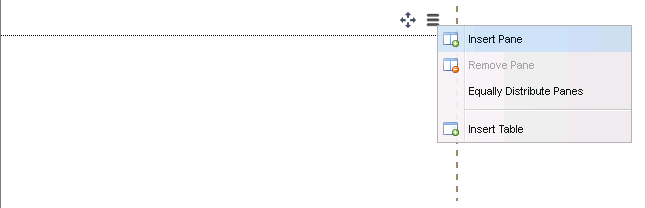
Click on the Options Icon above the Pane, and choose Insert Pane
- A new Pane should appear on the right — click and drag the dotted divider lines to resize the Panes:
- To add a Table, click on the first Pane’s Options Menu, and choose Insert Table
The Table defaults with one Column, one Header Row, and one Data Row
- Left-click on the Header Row and select Properties
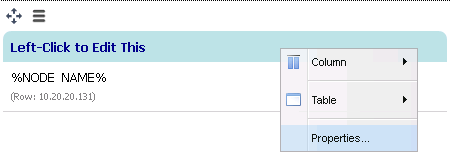
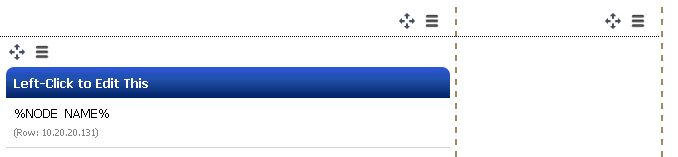
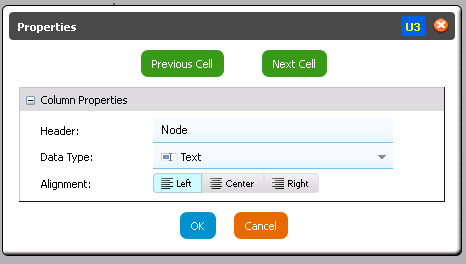
- Change the Header text to anything you like — for example, this column might be used to display each Node Name, so the Header text would be called “Node“, and the Data Type would be Text
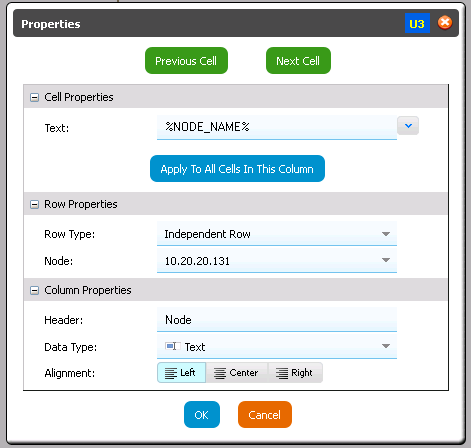
- Now left-click on the data row below the header, and select Properties
Since this is a data row, there are three properties that can be configured here:
- Cell Properties — unique to the cell itself
- Row Properties — applies to all cells in the row
- Column Properties — applies to all cells in the column
Under Row Properties, keep the Row Type as Independent Row, but change the Node to the desired node
Since this cell is a ‘Text’ data type, the Text field under the Cell Properties is what actually appears in the cell.
Different variables are supported, and can be viewed by clicking on the pull-down button at the end of the Text field.
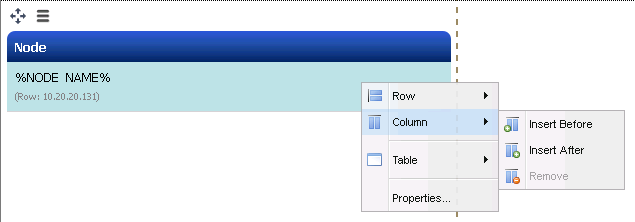
- To insert a new column, left-click on either the Header or the Cell, and choose Column and Insert Before or Insert After
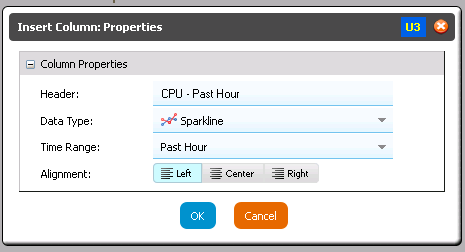
- This time, make Data Type as Sparkline, and set the Time Range to Past Hour and give the Header a text label, e.g. CPU — Past Hour
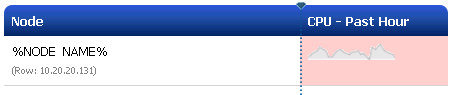
- Notice how the cell has a reddish background — this reminds users that required Cell properties have not been configured yet:
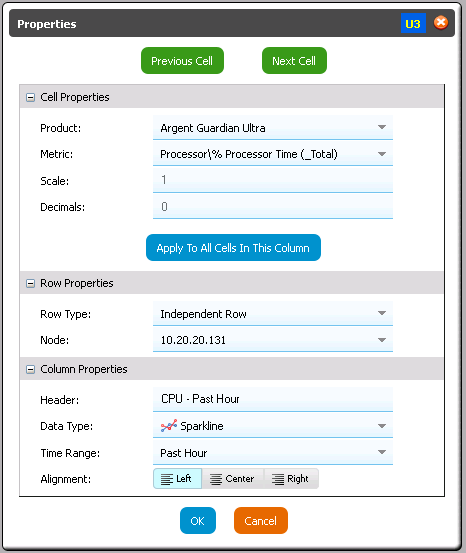
- Left-click on the new Cell and select Properties:
These properties are unique to the Sparkline column type.
Choose a Product, Metric and apply a Scale multiplier (if needed)
The number of Decimals can also be defined here
The Apply To All Cells In This Column is a convenience feature to mass-apply the current Cell properties to all other cells in the same Column within the same Table.
For example, if a customer changed their mind, and wanted all cells in the Column to show Memory instead of CPU, this only needs to be changed on one cell, then applied to all cells in the column.
The benefit of this is easy, mass change control.
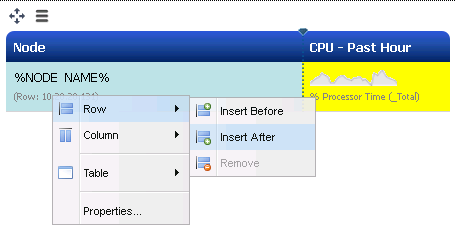
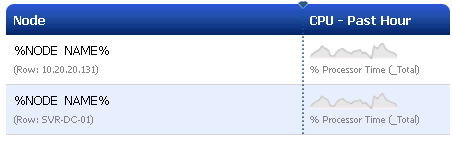
- Now that the columns have been set, add a new row by left-clicking on the first data row, select Row, and select Insert After
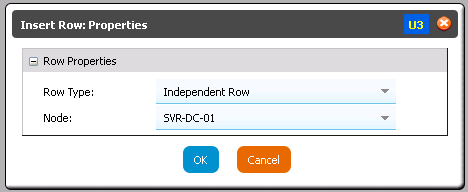
- A prompt will appear asking the user to define the Row Type and the Node
For this new row, change the Node to a different node
- For convenience, the new row clones the properties of the previous row.
Most customers will find that this greatly reduces the amount of work required to setup a table.
This is why it is always best practice to define the Columns, fill in the first row, THEN add new rows.
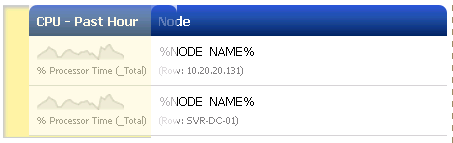
- Columns can be resized by drag and dropping the divider between Columns

- To re-order the columns, simply drag and drop the blue Header for the Column that needs to be moved:
- To move the entire Table itself, click on the Move icon above the Table, and drag it to another Pane, or under or above other existing Tables.
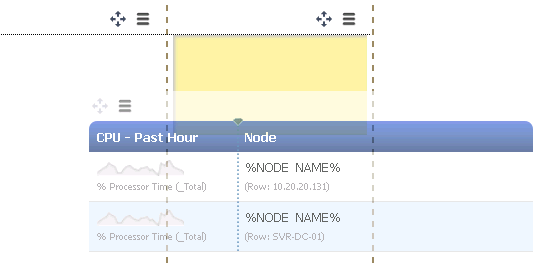
When moving a Table, the Table will always expand or contract to the width of the Pane it is contained in.
- Give the new View a name, and click Save
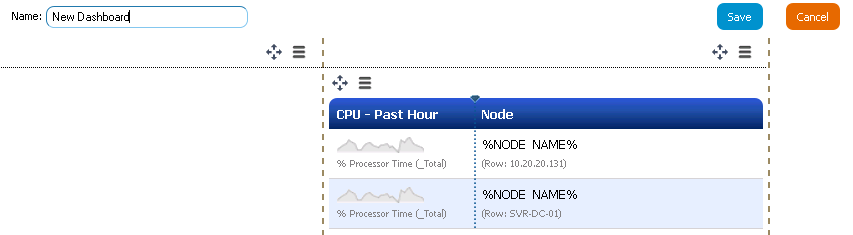
- The pulldown menu will now display the name of the new View that was created

- Hovering over the cells will give pertinent information on the data in the cell
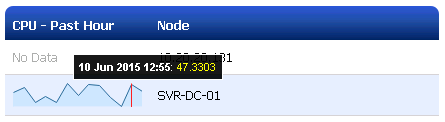
Customers can try hovering over each type of data to see how the extra hover information is laid out.