Performance Tables
Performance Tables display performance-related data in a tabular format
Moreover, Performance Tables can have Filters and can be used to display tables only if a certain number of lines match the criteria
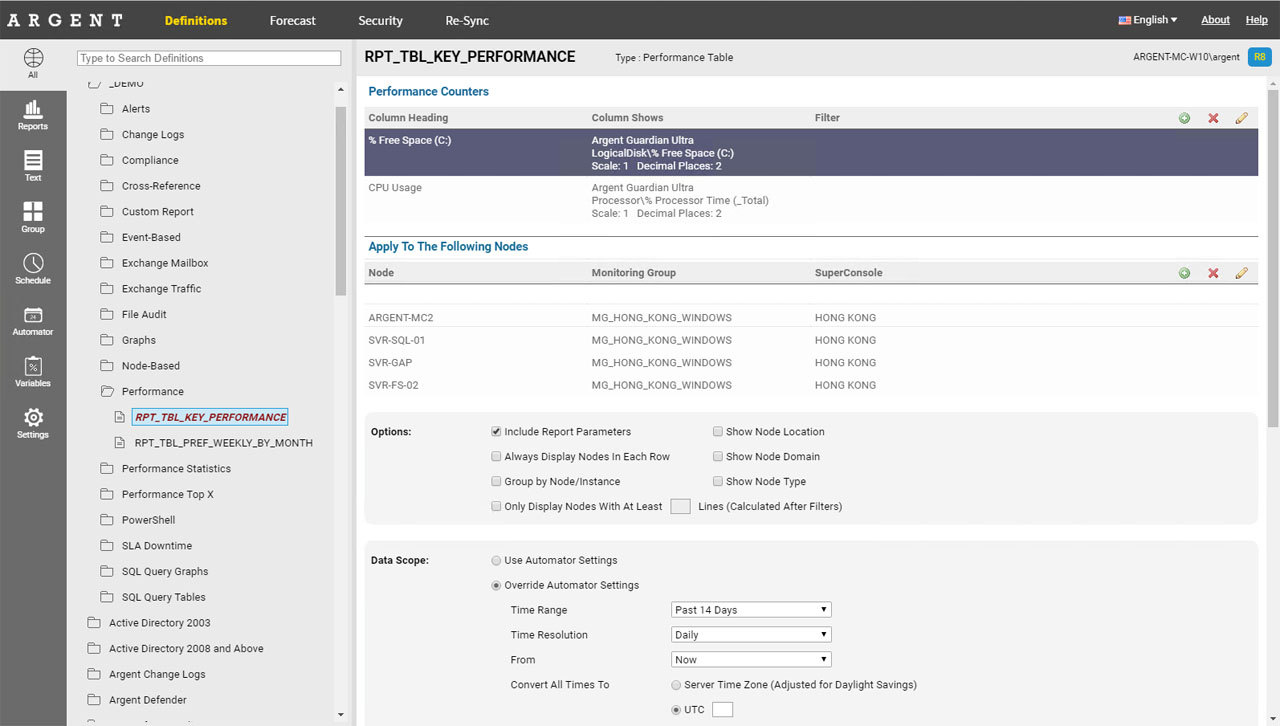
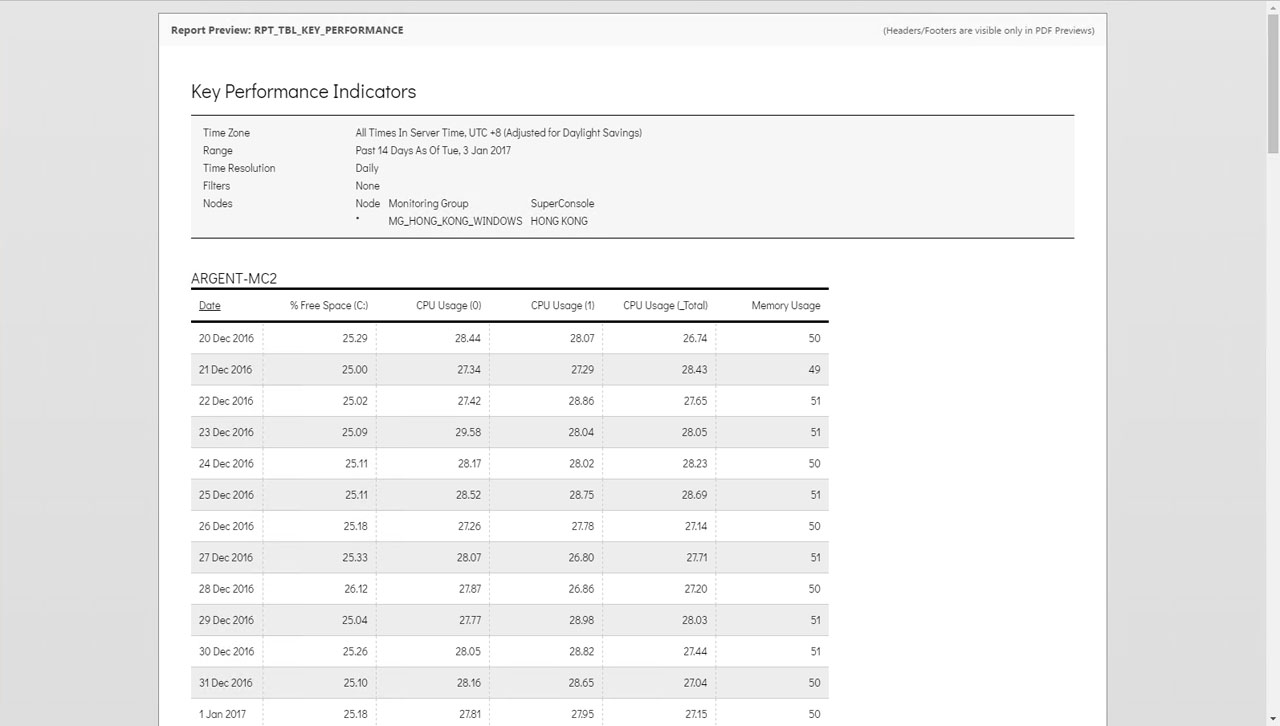
Important Note: The first and second columns of a Performance Table are reserved for the Date/Time and Node Name
Performance Counters
The Performance Counters here are used to define what will be displayed in what column
You can drag-and-drop to change the order of the columns
These aren’t just for Windows — these include SNMP metrics, Linux/Unix metrics, VMware metrics, etc.
The entire process is filtered for you — choose the Product and Argent Reports will automatically filter out the Objects and Counters that are available in the Argent database
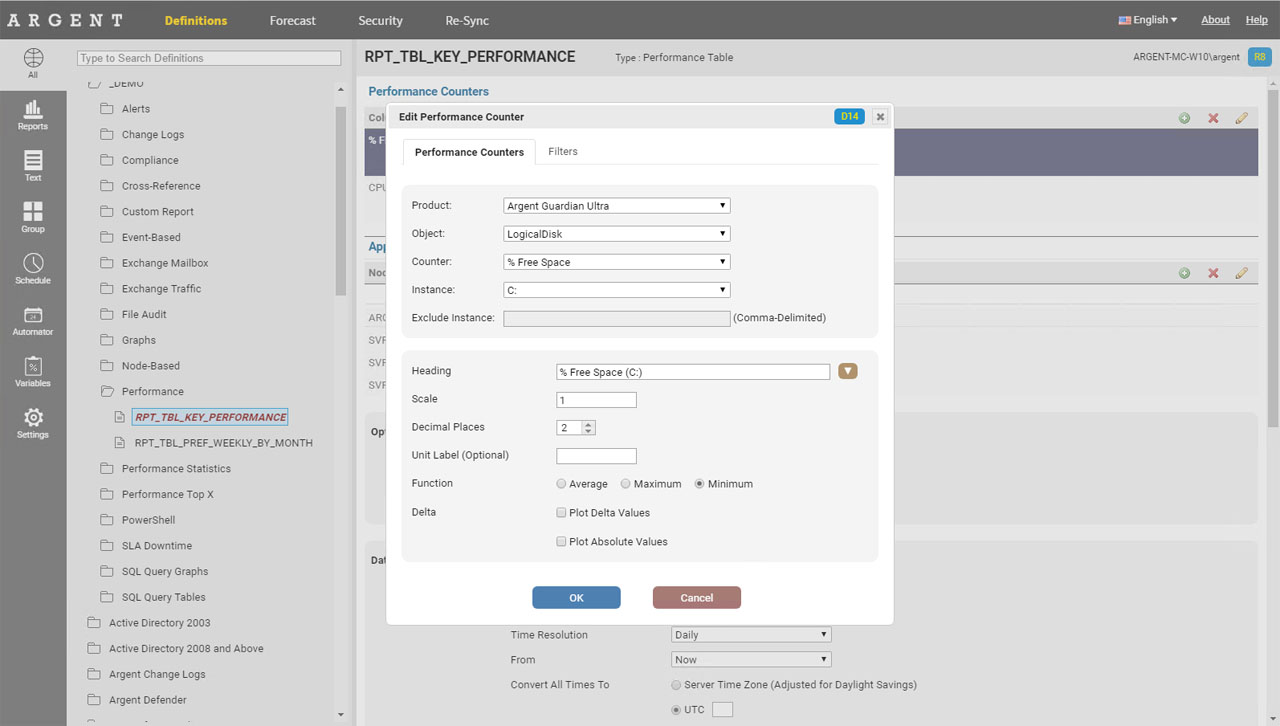
Heading
For each counter, specify a column heading — this controls how this counter should be displayed in the column heading
Scale
This useful feature allows you to multiply all retrieved values by a particular number
For example:
To convert “Bytes/sec” into “MBytes/sec”, you would set the scale to 0.000001
To convert “Service Level Agreement\SystemAlive” values as a percentage, set the scale to 100 (SystemAlive values are generated by System Down and SLA Rules, which return a 1 or a 0, depending on whether the node was down or not)
Function
All data is aggregated into “time buckets” based on the date range of the data
For example, for Past Hour or Past 6 Hours, the time bucket is 15 minutes
For Past Day, the time bucket is 1 hour
That means, we take all the data within each time bucket and we either do an Average, Maximum or Minimum of all data within each bucket, and boil it down to a single data point
Delta
This feature allows you to plot a graph of the change in the current and previous value
This is useful for disk space trending — to see how rapidly the rate of disk space consumption is occurring
Plot Delta Values can be positive or negative — which specify the direction of the change (e.g. positive = growth, negative = decay)
Plot Absolute Values forces all delta results to be positive — this is used for customers who aren’t interested in the direction per se, but rather the raw magnitude of the difference, regardless of whether it was growth or decay
Filters
One of the main differences between Argent Tables and Argent Graphs are the inclusion of Filters
Filters are located on the second “tab” in the Performance Counters popup
Filters are always done with an implicit AND operation with other columns
For example, let’s say we have the following data:
If we had a filter on % CPU > 30
And
If we had a filter on % Free Space > 40
We would end up with just one line from the example above:
It is the only line that matches % CPU > 30 AND % Free Space > 40
Only Display Nodes With At Least X Lines Or Occurrence Count (Calculated After Filters)
When applying a Report to an entire Monitoring Group, you may come across servers that don’t have the data, or don’t have data that match the filters.
Instead of displaying masses of empty tables that say “No data could be found…”, you can simply not display a table for a node if it doesn’t have at least X number of lines