KBI 310341 Alerts Delayed By 5 to 10 Minutes
Version
Argent AT — All Versions
Date
7 Jan 2013
Summary
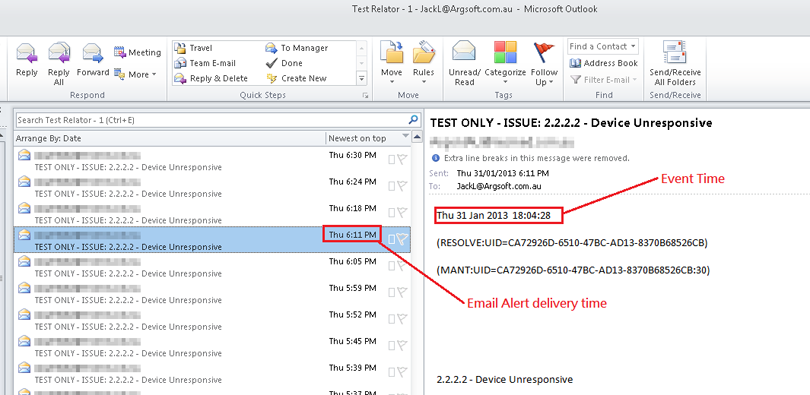
Customers may suffer a delay of up to 10 minutes in delivery of any Alert, say, an Email Alert
This can be seen by referring to the Event timestamp of the alert and the email delivery time showed on email client

Customers may also see numerous (30+) Argent monitoring processes at any given time, which may result in the overconsumption of non-interactive desktop heap
Technical Background
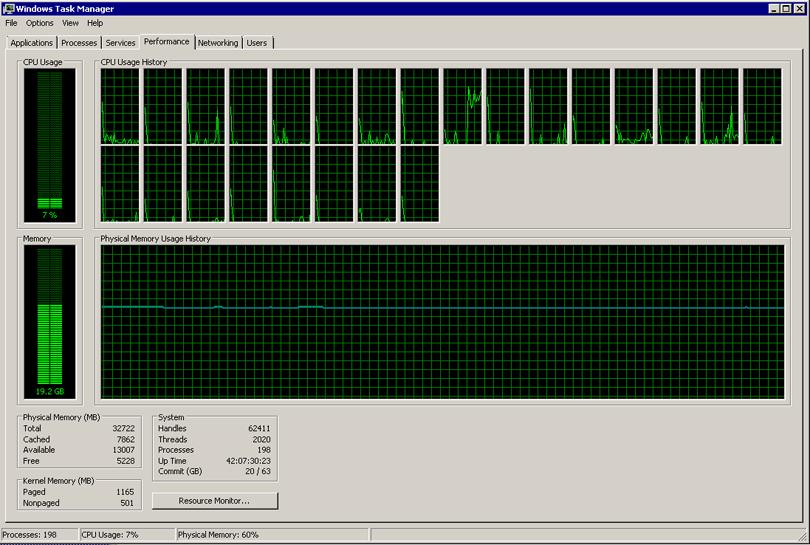
Assuming the email gateway is working correctly, then the next area to check is the Argent AT server load, this is best done by checking CPU and memory:

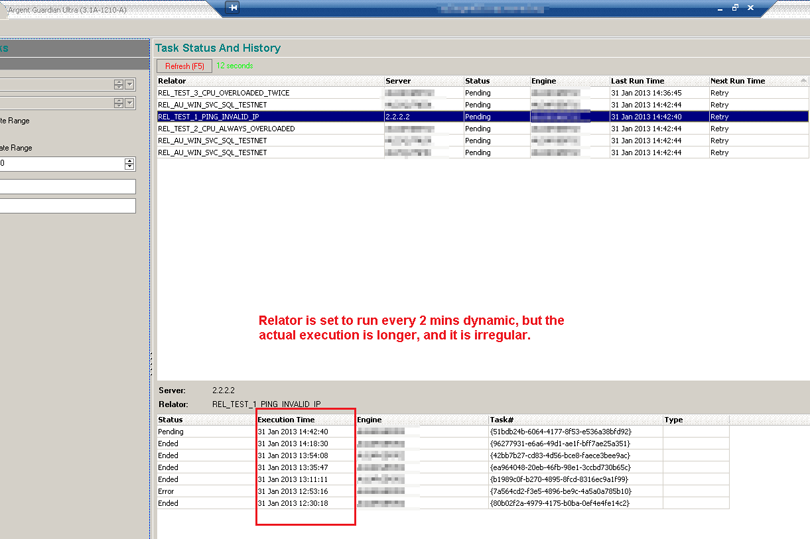
A delay in Relator Task execution is an key indicator of the Argent Engine being overloaded
For example, a Relator is configured to run every two minutes, but the “Task Status And History” screen below shows delays and irregular execution time

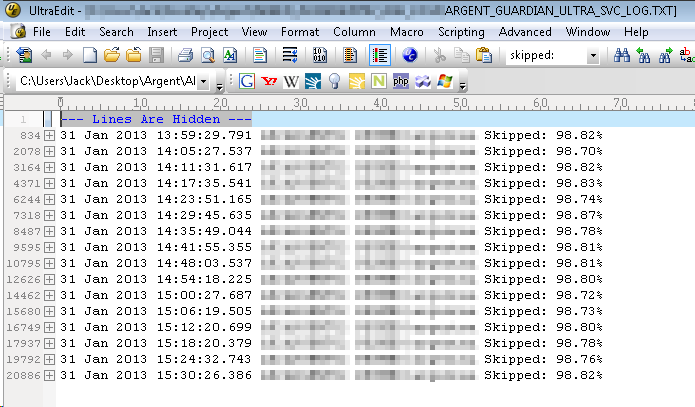
An even better indicator is a sustained high skipped rate found in the product service log:

Resolution
Argent AT provides two methods of executing tasks — this is configured on a per-Relator basis.
A new process can be spawned for each task, or a shared process can be used when executing the task.
In Argent AT, there are implications to consider when using either method:
Spawn New Monitor Engine Process
For each task, a new process is spawned. This allows tasks to execute independently, and in some cases concurrency e.g. (in parallel — such as vCenter, which only allows one connection per process)
However, this also increases the resource usage of creating new processes, and creating new initial connections to a remote server or application
Use Shared Monitor Engine Process Pool
For each task, a shared process pool is re-used. This re-uses open connections to the remote server which significantly reduces the load.
Less processes are spawned, but if a particular task fails and crashes the process, it affects other tasks as well.
Argent AT assigns three shared process pools by default. You can specify the exact process pool to use (Pool #1, Pool #2, Pool #3), or you can use the {Dynamic} option, which dynamically allocates the task to the next freed up Pool.
In other words, under the default settings, and when {Dynamic} is used with shared process pools – up to three simultaneous tasks can be executed at one time – the rest will be queued.
Changing to Use Shared Monitor Engine Process In Pool will always significantly save on resources.
If the default of three process pools is not enough, you can increase the total number of shared process pools by going to Administration, Supervising Engine, and changing the Shared Monitor Engine Process Pool Size.
Example: From 3 to 15.
This simply means that a maximum of 15 shared process pools will be spawned instead of the default of 3
After making this change, you can see that this has taken effect by going back to your Relator.
You’ll see the number of Pools have increased to what you specified:
If you have hundreds of Relators and would like an automated approach to changing all Relators to use the dynamic/shared process pool, please contact Argent Support