KBI 311036 New Feature: Argent Commander Grouped Graphs By SuperConsole Or Monitoring Group
Version
Argent Commander 3.0A-1407-A and above
Date
Friday, 1 Aug 2014
Summary
Argent Commander has a new View – “View by SuperConsole”
The “View by SuperConsole” and “View by Monitoring Group” now has a new feature, which is initially disabled after upgrade
When enabled, the new feature allows customers to click on the SuperConsole, or Monitoring Group, and generate multi-line graphs for all Nodes in the Monitoring Group
The reason the feature is initially disabled, is because this feature, while very powerful, needs to be carefully planned, as some customers may have hundreds of Nodes within a single Monitoring Group or SuperConsole
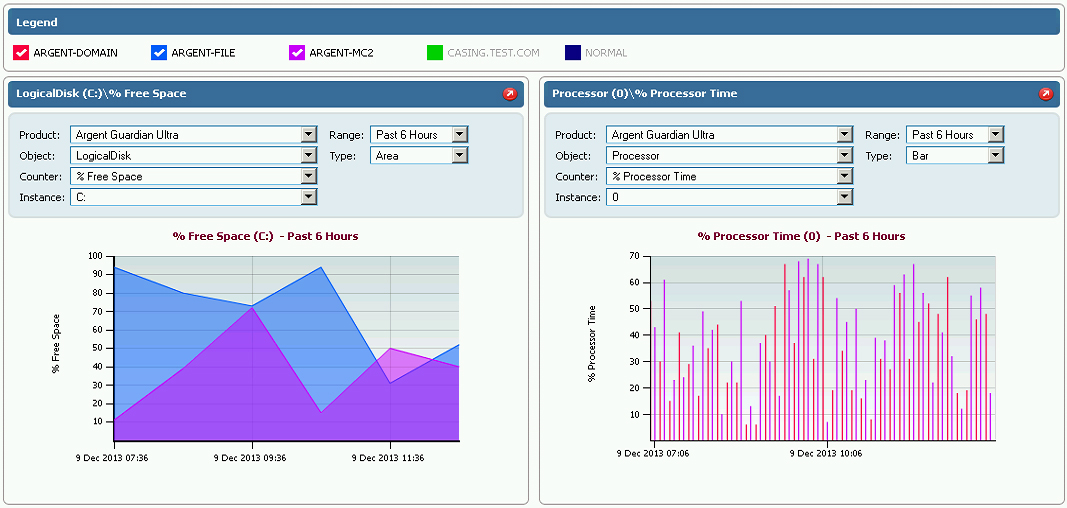
The Legend at the top is a common legend for all graphs – up to 10 graph modules can be added for each SuperConsole or Monitoring Group
The legend itself is interactive – hide or show Nodes from all graphs on the page by clicking on the legend
Each page is also uniquely saved and persistent for each SuperConsole or Monitoring Group – Performance Matrices also work to apply a template onto other Monitoring Groups or SuperConsoles
Technical Background
After upgrading, customers can enable this feature by opening the XML\ARGSOFT_INTERNAL_SETTINGS.XML file
An XML entry called “CLICK_GROUPS” will be present – a value of “0” means disabled (default), and “1” means enabled
Limits
- A maximum of 30 Nodes will be loaded for a particular group – this limit can be changed, but only with assistance from Argent support
- Customers at the maximum number of Nodes trying to process data over a yearly period should expect loading times to be lengthy, and the chart visualization itself to almost useless (too many lines on a single graph)
Resolution
Upgrade to Argent Commander 3.0A-1407-A or above