Monitoring Bandwidth Utilization in Argent SNMP Monitor
Introduction:
Korean Business News Ltd. wanted to monitor/trend the bandwidth utilization on the switches connecting two disparate networks.
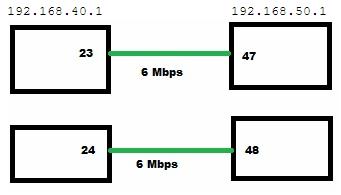
Visualize as LEFT and RIGHT:
- LEFT and RIGHT are connected by 6Mbps pipes
Each network segment contains two switches.
- two switches in LEFT are 24 port switches
- two switches in RIGHT are 48 port switches
- all four switches are same base model (CISCO 3560G, with differing port counts)
- two switches on each “side” are combined into a VLAN, mapping to a single IP address on each “side”
Connections from LEFT to RIGHT are point to point, and breakdown as follows:
- port 23 on LEFT switch connects to port 47 on RIGHT switch
- port 24 on LEFT switch connects to port 48 on RIGHT switch
:
The following document discusses calculating bandwidth utilization using SNMP:
http://www.cisco.com/en/US/tech/tk648/tk362/technologies_tech_note09186a008009496e.shtml
The formula used is straight forward, and easy to implement in Argent SNMP Monitor:
(for half duplex connections)
More accurately, for full duplex connection:
(ΔifInOctets x 8 x 100) / [(number of seconds in Δ) x ifSpeed] = interface IN utilization
(ΔifOutOctets x 8 x 100) / [(number of seconds in Δ) x ifSpeed] = interface OUT utilization
Some notes:
- ifSpeed might be “less accurate” in practice, since this value is derived from the cable used. i.e. the cable used is probably Cat-6: Gigabit Ethernet. In our case, the link tops out at 6Mbps.
- The delta will be subjective, but I chose 60 seconds (relators on 1 minute intervals).
.1.3.6.1.2.1.2.2.1.10: ifInOctets
.1.3.6.1.2.1.2.2.1.16: ifOutOctets
Doing a walk starting from either of these OIDs will list the actual ports or interfaces the switch contains. In KBN’s example,
.1.3.6.1.2.1.2.2.1.16.10123: maps to the port 23 on the LEFT switch
:
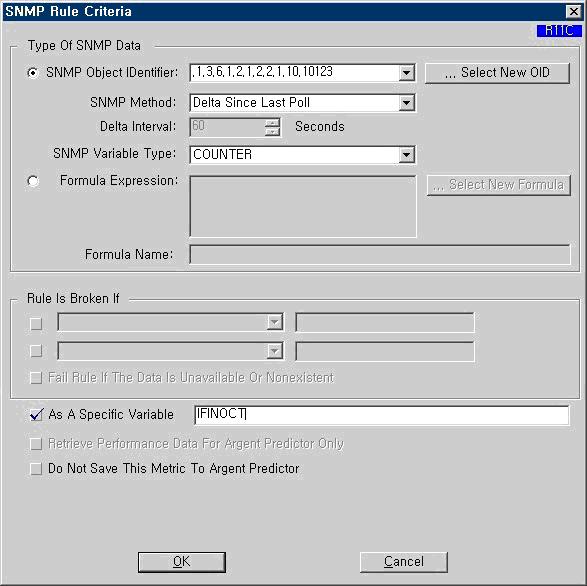
The sample rule created. We input the OID of the port (interface) we wish to track input octets from. Our SNMP method will be Delta since last poll, since the interface octet values require the use of a delta. We store the value as a variable, IFINOCT.
:
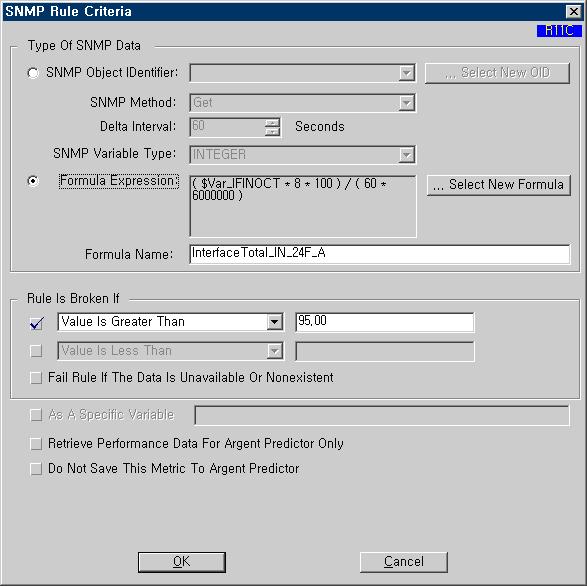
We use the formula provided by CISCO, using a delta of 60 seconds, and replacing the ifSpeed value with the value of our line, in this case 6000000 (6Mbps). Note in our case, using the actual ifSpeed (1Gbps, or 1,000,000,000) would produce inaccurate results, since the pipes top out at 6Mbps anyway.
We store the formula as a name. In KBN’s case, we needed 4 different formulas: 1 for each interface on each side. We used four distinct names, so we could produce accurate graphs. The threshold is set for 95% (the lines are close to “full” at this time, customer wants to be alerted when in the “red zone”).
In the actual rule definition, we chose to save the data to Argent Predictor.
We defined four relators:
LEFT switch port 23 in/out
LEFT switch port 24 in/out
RIGHT switch port 47 in/out
RIGHT switch port 48 in/out
I chose to use separate relators for clarity. 2 relators would work as well (one for each “side”). Note in this case, combining sides would not work (the interface checks for the 48 port switches would produce invalid results when checking against the 24 port switches).
Conclusion:
Monitoring bandwidth utilization is possible using Argent SNMP Monitor. Please keep in mind, due to overhead not being discounted, this isn’t a 100% accurate measure, but gives customers a good estimate to use in alerting.