VMware Monitoring Basics
Question #1
Can you create a new rule that will take the percentage of free memory from physical memory?
Answer:
There is a built-in Rule that monitors Free MB of Memory falling below a specified threshold (100 MB by default).

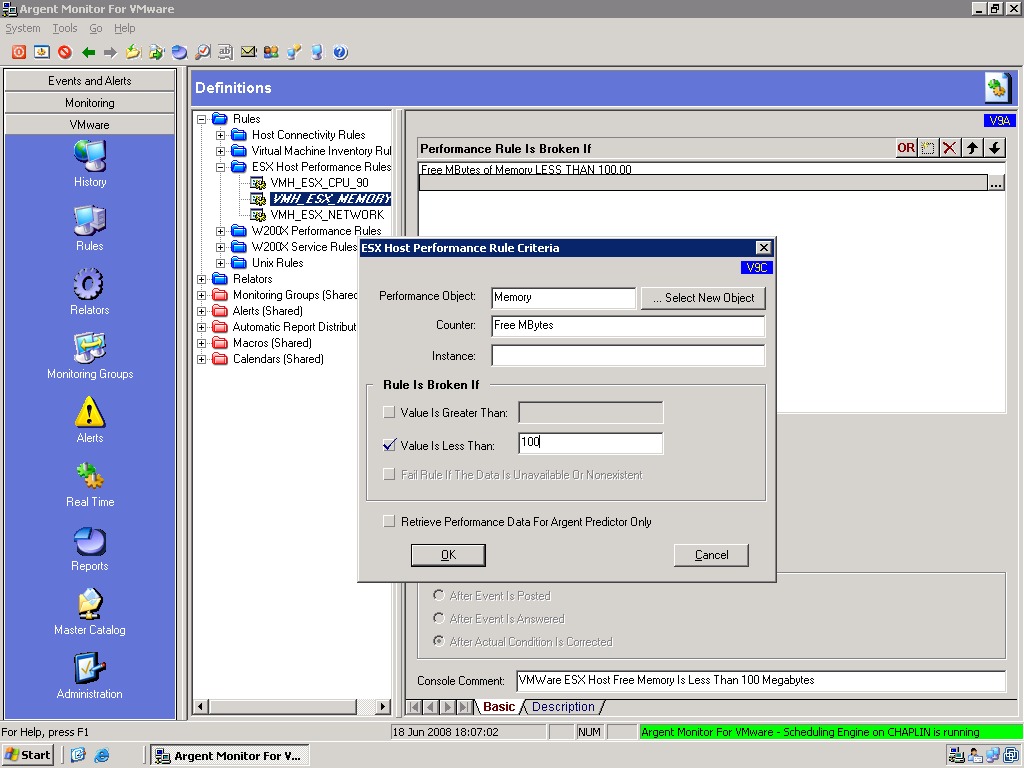
You can create additional Memory Rules by selecting the square button on upper-right between the ‘OR‘ and ‘X‘ buttons.
Next select the “Select New Object” button:

This will load and display a list of all the ESX Memory counters built-in to ESX VMWare.
There doesn’t appear to be an exact counters for % free Memory. Probably the most common way to monitor for low memory is using the Free MB counter as detailed above.

You can then select any of these counters and set a threshold on them using the checkbox options under “Rule Is Broken If“:
Question #2
Where are the actual rules stored on the main engine?
Answer:
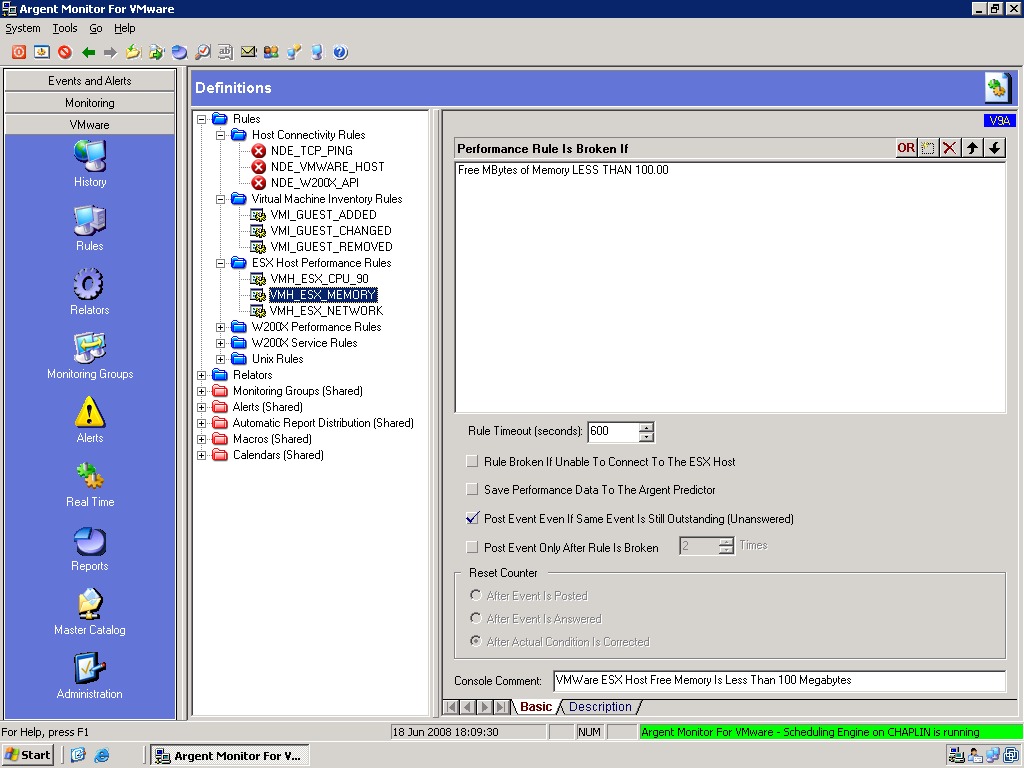
They are located in the GUI of Argent Monitor for VMWare by selecting the ‘Rules‘ icon on the left-hand pane.
The core functionality for ESX servers are using the ESX Host Performance Rules to monitor for ESX performance statistics such as CPU, Memory, etc.
The Virtual Machine Inventory Rules also provide the ability to monitor if any VM Guests have been Added, Changed, or Removed on the ESX machine.
The Host Connectivity Rules provide the ability to monitor connectivity to the ESX machines using the more granular SSH Login method in addition to the standard Ping.
Question #3
How can I see the actual commands being run from some of rules like VMH_ESX_MEMORY
Example: esxtop “options”…..
Answer:
Unlike the Unix shell script Rules you are familiar with when monitoring standard Unix machines, Argent uses a VMWare API to get access to the esxtop counters and display them in a ‘user-friendly’ interface when creating custom Rules.
Here is the sample output when running a Relator Test of the Memory Rule against an ESX server.
Relator Test Results:
—————————————————————
Rule: VMH_ESX_MEMORY
Server: vienna
Result: Not Broken
Performance Rule is not broken
Rule Testing Trace Logs:
18:11:55.280 – VMware Server Host: vienna
18:11:55.280 – VMware Server Port Number: (default)
18:11:55.280 – VMware Server Logon Account: root
18:11:55.280 – CVMWareInterface::GetPerformanceMetric…
18:11:55.280 – Acquired server session permit
18:12:12.890 – [Memory].[Free MBytes] = 11221.0000
18:12:12.890 – Released server session permit
18:12:12.890 – Completed CVMWareInterface::GetPerformanceMetric
VMware Host Performance Metrics
—————————————————————
Argent uses a VMWare API to get access to the esxtop counters and display them in a ‘user-friendly’ interface when creating custom Rules with the Rule wizards.
The back-end code for getting access to these counters is not ‘exposed’ as it would be in a script rule, but is displayed like so in order to make it more user-friendly to select and define a threshold on a counter without having to write a script.

Question #4
Is there a rule available or can it be created to tell me which VM guests are using the most CPU and Memory on the ESX server?
Answer:
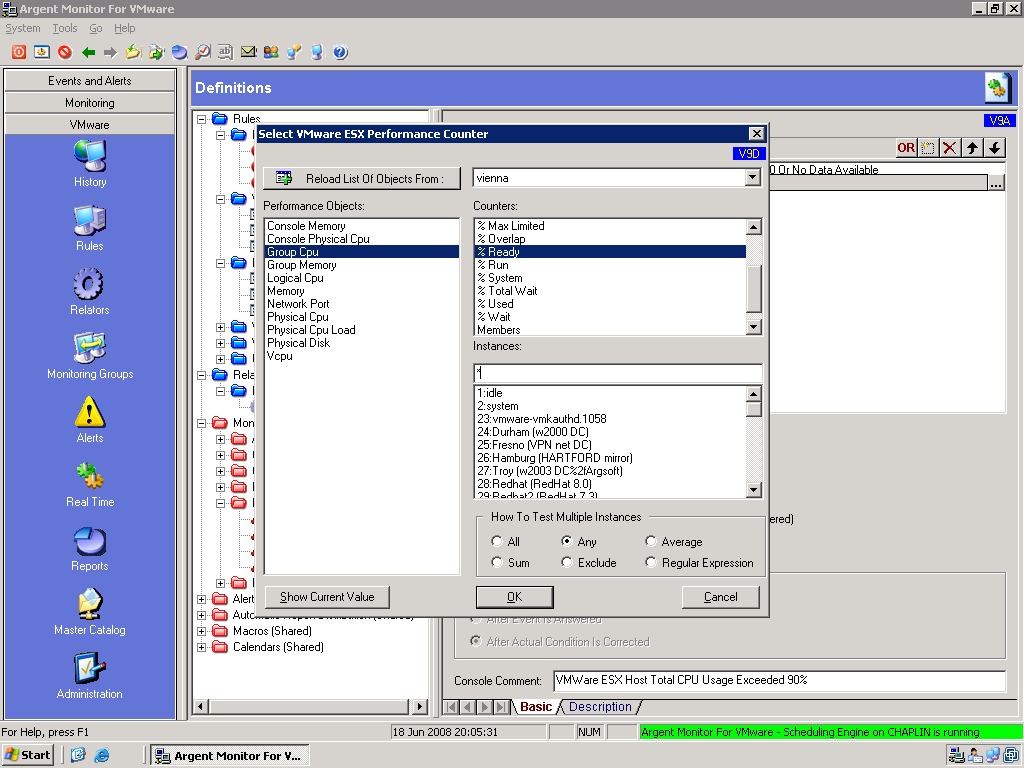
In the ESX Host Performance Rule wizard, you will find Performance Objects named ‘Group CPU‘ and ‘Group Memory‘. Notice that the Instances of these Counters are the VM guest instances on the ESX server.
You can select ‘*’ and ‘Any’, and it will collect that counter for all the VM Guest instances on the machine.
This could then generate a report similar to the one below in which it displays utilization for all the VM guests on an ESX server:
