KBI 311773 How To Read Argent AT Engine Health Statistics
Version
Argent Advanced Technology – All versions
Date
Thursday, 22 August 2019
Summary
Argent AT Engine exports system health statistics once every five minutes
User can view the information in Main GUI, or directly read file AT_SVC_PERF_STAT.TXT under LOGS folder
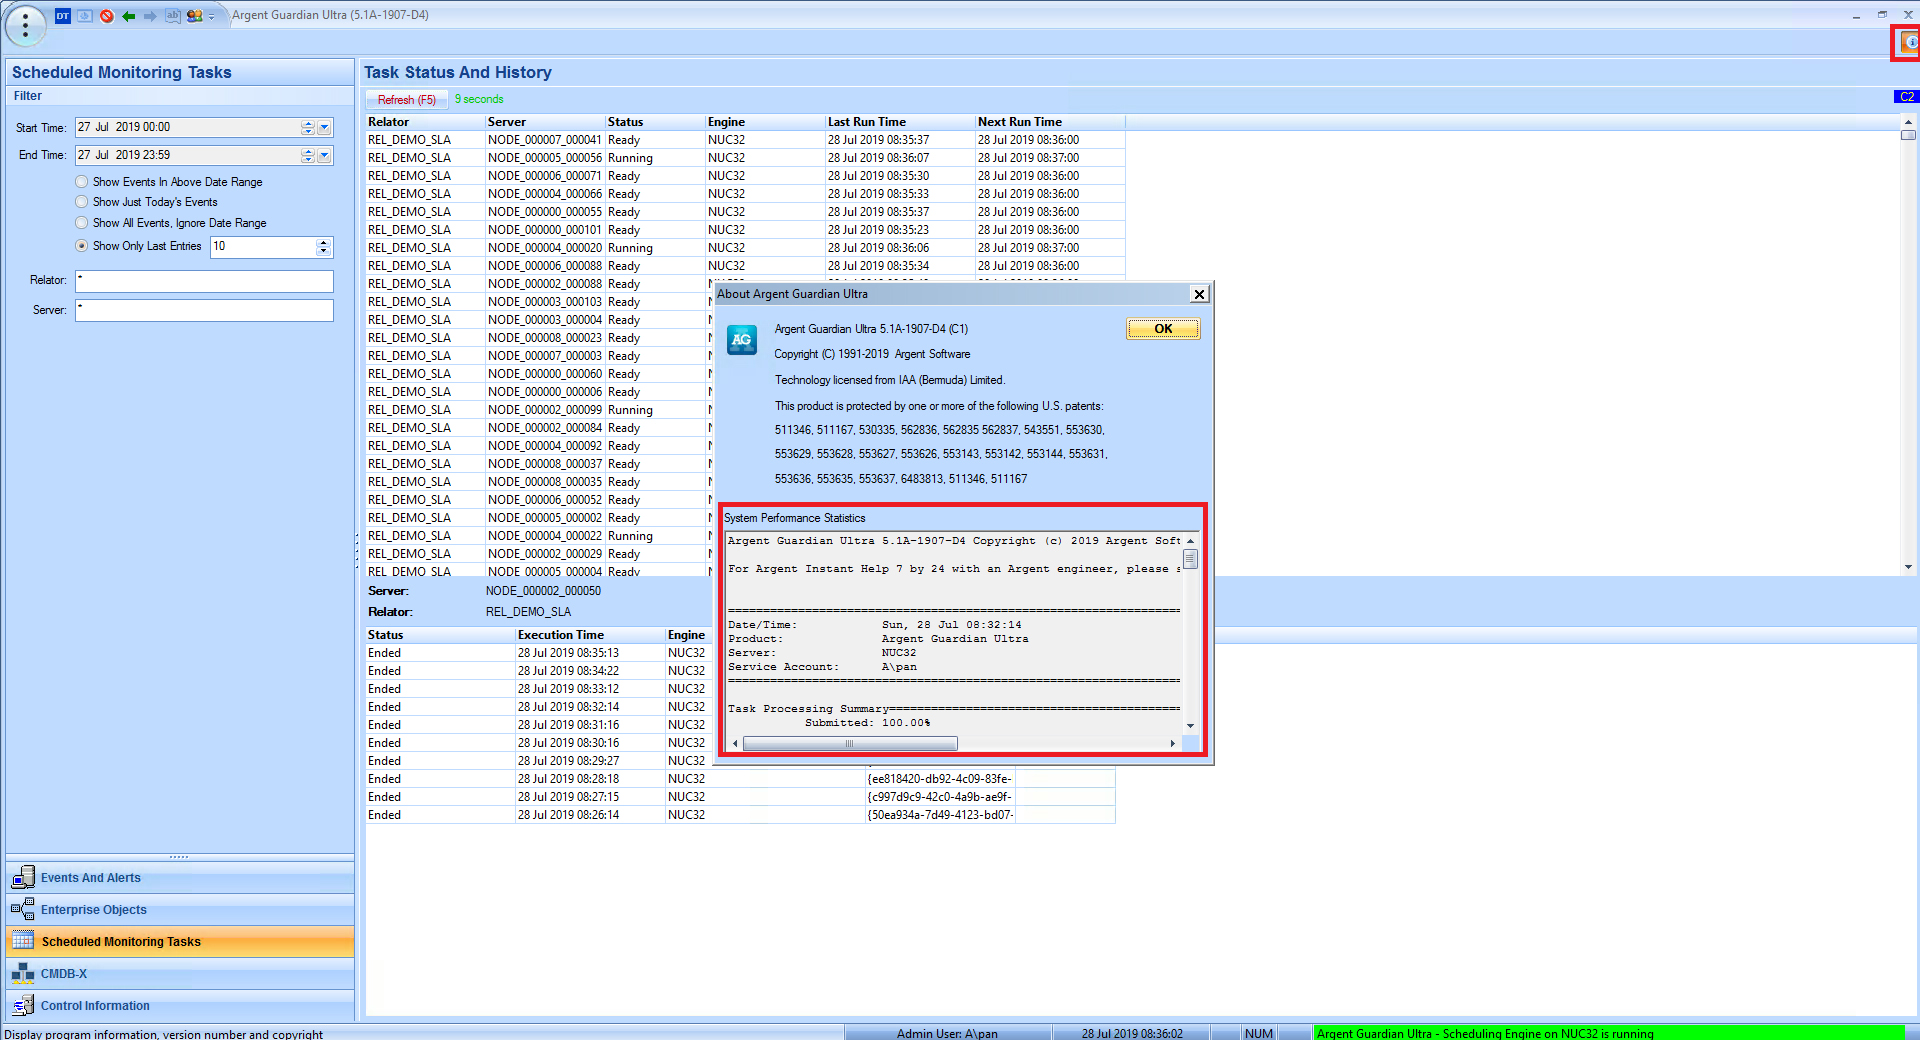
A typical statistics is as follows:
Argent Guardian Ultra 5.1A-1907-D4 Copyright (c) 2019 Argent Software
For Argent Instant Help 7 by 24 with an Argent engineer, please see http://help.Argent.com/help.php
================================================================================================================Date/Time: Sun, 28 Jul 08:32:14
Product: Argent Guardian Ultra
Server: NUC32
Service Account: A\pan
================================================================================================================
Task Processing Summary ========================================================================================
Submitted: 100.00%
Failed To Start: 0.00%
Cancelled: 0.00%
Skipped: 0.00%
Late: 0.00%
Local Running: 0
Throughput/minute: 1,020
Task Late (seconds): 22 (Max: 58 Min: 3)
Data Points: 5,101
Throttled Events: 0
WO Queue Length =============================================================================================
Average: 0
Max: 1
Min: 0
Last: 0
Start Time: Sun, 28 Jul 08:27:12
Last Time: Sun, 28 Jul 08:32:14
Data Points: 93
WO Handling Summary ===========================================================================================
Total: 1
Average: 0
Max: 1
Min: 0
Last: 0
Start Time: Sun, 28 Jul 08:27:12
Last Time: Sun, 28 Jul 08:32:14
Cumulative WOs: 4
Pending Event Queue: 37
Post Event Queue: 0
Data Points: 93
System Runtime Metrics (Milliseconds) ========================================================================
WO Creation Time: 37.05
WO Processing Time: 1,172.00
Spawn Process Time: 1,078.00
Task Execution Time: 7,000.00
Event Recheck Time: 539.00
Event Firing Time: 244.98
Event Lapse Time: 12,405 (Max: 47,000, Min: 0)
Pre-Submission Time: 0.23
Post-Submission Time: 3.03
=============================================================================================================
Free DB Space: 250.27 Mb (20.06%)
Pooled Database Connection#: 9 (7 Currently Used)
The most important numbers include:
- Submitted – If it is constantly less than 90%, system is experiencing significant issue. Further checking following statistics
- WO Queue Length – If it is more than 3,000, check if running SLA or System Down Rule with high frequency (interval < 2 minutes)
If so, set registry ‘RUN_DOWN_RULE_THREAD_MODE’ to 2, so that the tasks can be executed within Supervising Engine process
- Pending Event Queue – If it is more than 3,000, system is very slow processing result WO files
It can cause very late alert firing or missing Argent Predictor data
First of all, check if any Rule is mistakenly causing event flooding
For example, Argent for Compliance Rule might be broken on every Event in Event Log
If it is not the case, check if SQL Bulk Insert has been turned on, and upgrade to Argent AT 5.1A-1907-A or later for better performance
- POST Event Queue – If it is more than 3,000, Argent Console engine is experiencing congestion
The most important to check if any Rule is causing event flooding
- Skipped/Cancelled – If any is more than 5%, checks if Pending Event Queue is high
If not high, Monitoring Engine Process is running Rule slow
For example, PowerShell Script Rule might be incorrectly programmed and stuck in a user prompt
- Task Late – If it is more than 180 (3 minutes), system hardware and software are not handling monitoring tasks fast enough
If CPU usage is constantly above 90%, consider adding motor to distribute the load
- Pooled Database Connection – If it is more than 30, SQL Server backend is very slow
Technical Background
N/A
Resolution
N/A