KBI 312038 Enhancement: Implemented Log Visualizer Module In Argent Omega
Version
Argent Omega 2.2A-2301-A and above
Date
Tuesday, 24 January 2023
Summary
The Argent Omega Log Visualizer is used to present the log data collected by Argent Compliance Automator and Argent SIEM-Complete. Log data provides information on critical events such as authentication and authorization failures, file or folder access events, process creation or exit events, and more that are happening in a network.
Argent Omega Compliance Automator and Argent SIEM-Complete centrally archives event log records from multiple sources. When organizations move to centralized log collection from multiple sources within the network boundary, it becomes difficult to understand when, where, and why things happen when large volumes of data are involved. To address this situation, it is important to have a log management solution that not only aggregates the logs but also enables users to better visualize the data and gain critical insights. The Log Visualizer module in Argent Omega provides different forms of log visualization for better understanding the collected logs.
Technical Background
Better visualization of event logs, SYSLOGs, and other log types enables administrators to analyze data and take quick action during downtime or security breaches.
With Log Visualizer, you can:
- Get real-time visualization of log data.
- Create log data presentations to show the desired log data in the form of charts and graphs.
- Advanced log filtering options for drilling down raw logs relevant to any event of interest.
- View the log trends for a particular timeframe.
- See the live status and severity of the logs generated by monitored devices.
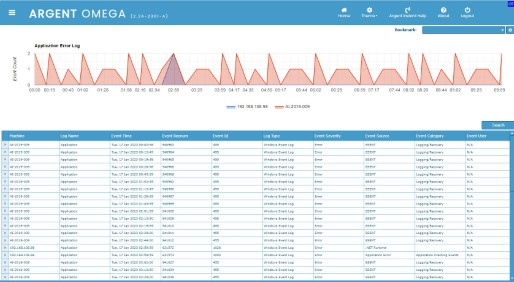
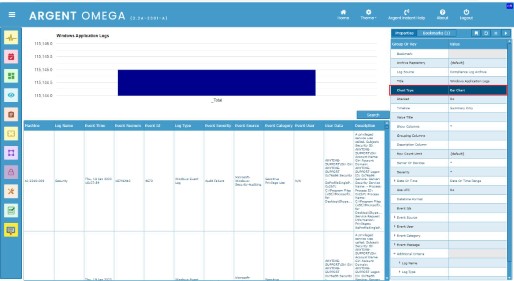
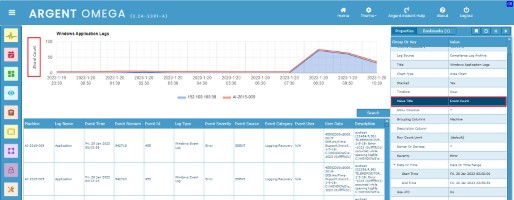
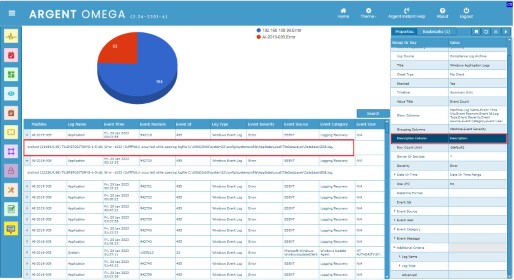
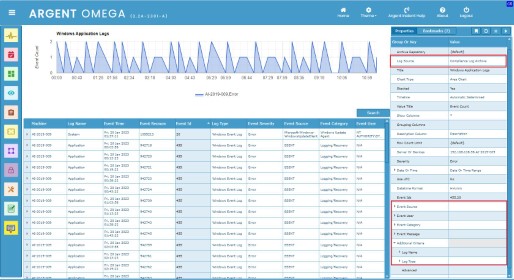
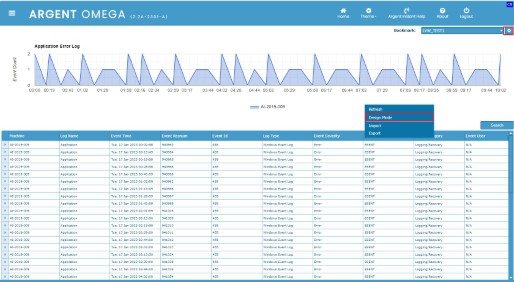
The event visualization screen is horizontally split into two portions. The upper portion shows the graphical view of the selected log data. The lower portion displays the filtered event records in tabular form.
The following is the log presentation screen created using Argent Omega Log Visualizer:
Creating New Log Presentation Screens
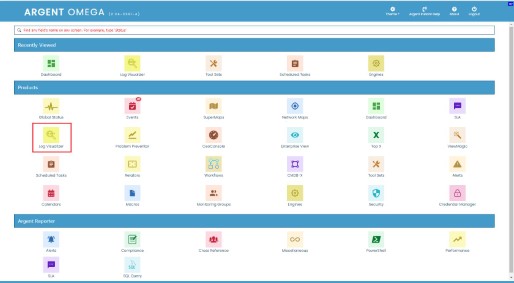
Click on the Log Visualizer home menu item to create or design, view and manage log presentation screens:
You will be navigated to the design page of Log Visualizer. Configure the properties in the right pane according to your requirements:
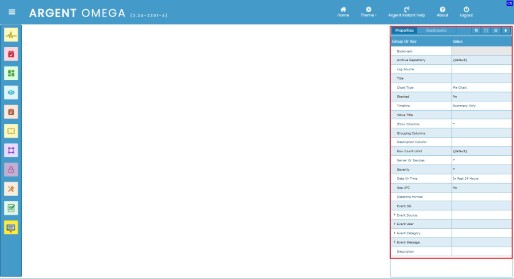
The use of each property in the properties pane will be described below.
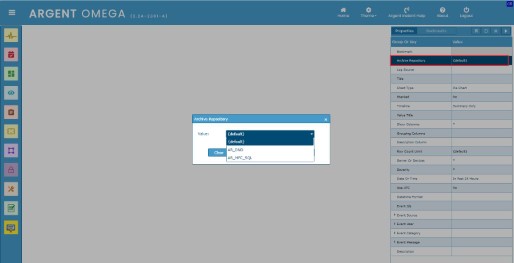
Archive Repository
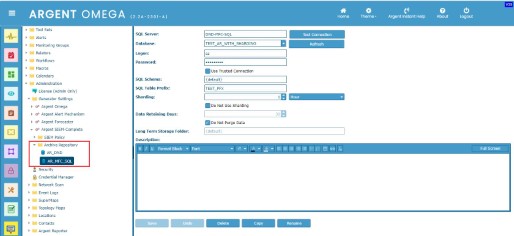
Argent Omega Compliance Automator collects event log records from multiple sources and archives to a specified SQL Server database. Archive Repository defines the SQL Server database details to archive compliance data retrieved by Argent Omega Compliance Automator. There are situations where multiple Archive Repositories need to be maintained in Argent Omega. Archive Repositories are maintained in Argent SIEM-Complete section in Argent Omega:
Choose the Archive Repository from combo box. By default, it uses the “{default}” Archive Repository that comes with Argent Omega:
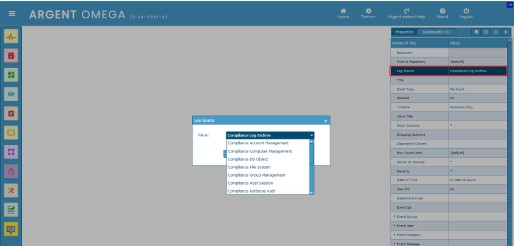
Log Source
Depending on the Rule configuration, Argent Omega Compliance Automator and Argent SIEM-Complete archive different types of event log data to different database tables. For example, Windows process events and file or folder access events are stored in different database tables. Choose the Log Source from the combo box. It can be one of the following:
- Compliance Account Management
- Compliance Computer Management
- Compliance DC Object
- Compliance File System
- Compliance Group Management
- Compliance Host Session
- Compliance Kerberos Auth
- Compliance Log Archive
- Compliance Logon Logoff
- Compliance NPS Operation
- Compliance Policy Change
- Compliance Process Event
- Compliance System Event
- Compliance Task Event
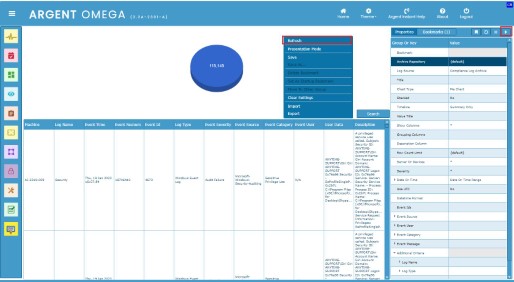
Click the Refresh button or context menu option to retrieve and present the log data from the specified source:
Title
Define the title for the chart in Title property:
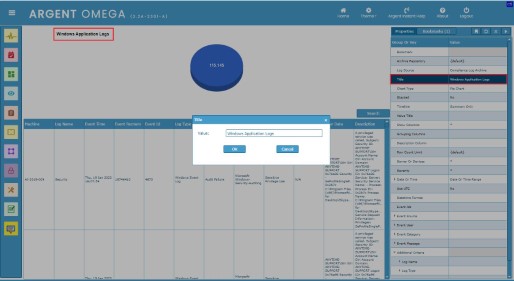
Chart Type
Select the type of graph in Chart Type combo box. It should be one of the following:
- Pie Chart
- Bar Chart
- Line Chart
- Area Chart
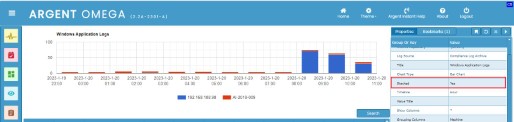
Stacked
The Stacked property is applicable only for bar charts. It specifies the style of the bar chart. When “stacked” is set to yes, they appear as a series of columns or bars stacked on top of each other:
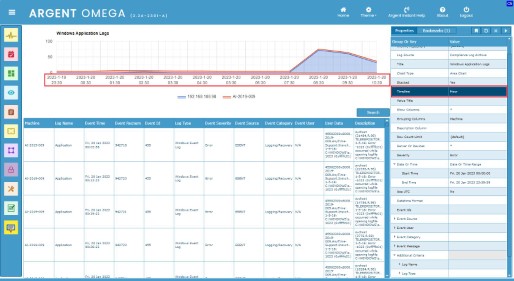
Timeline
Select the unit from the Timeline combo box to show timeline statistics in the chart. Line and Area charts are best to display timeline statistics. The following is a sample hourly timeline chart:
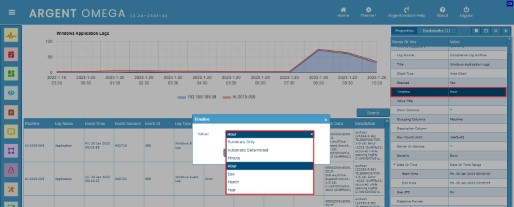
The following timeline options are available:
- Summary Only
- Automatic Determined
- Minute
- Hour
- Day
- Month
- Year
Use the Summary Only timeline option to use the count of grouped log records for charting. Need to specify one or more columns to group on.
Use the Automatic Determined option to automatically determine the timeline from retrieved log data:
Value Title
The Value Title property specifies y-axis title for its values:
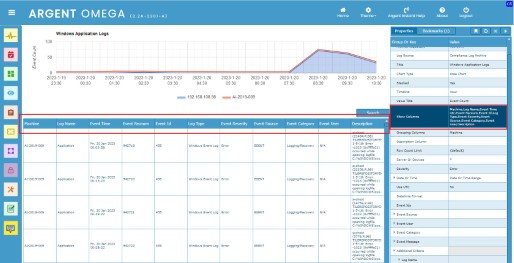
Show Columns
Select the required columns from the Show Columns list. The values of selected columns will be displayed in the lower part table. By default, it displays all columns available in the log data table:
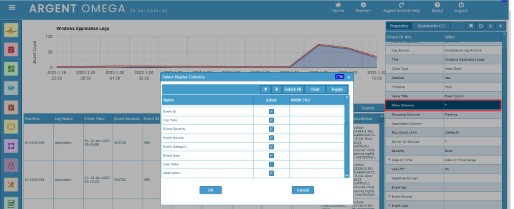
The values of selected columns will be displayed in the table:
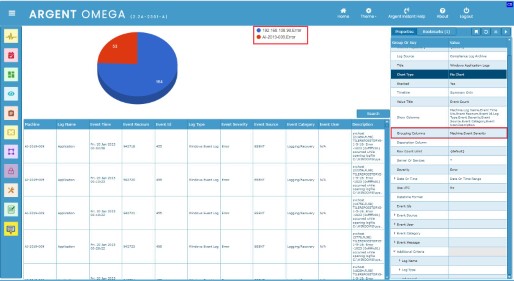
Grouping Columns
Select one or more columns to group on. The grouping is used for charting. It uses the count of grouped log records for charting. If no Grouping Columns are specified, the count of all event log records is used. Bar or Pie charts are used to display grouping statistics:
Description Column
Choose one column as the description column in the lower part table. The value of the Description column will be displayed in another row. It is a good idea to assign a column that has lengthy values as the description column:
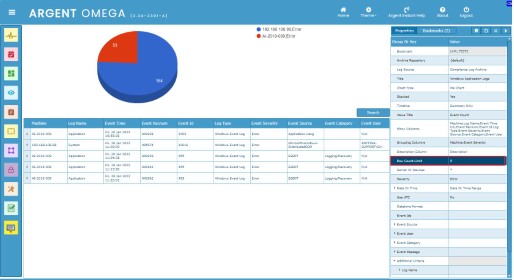
Row Count Limit
Specify the number of rows to be displayed in the table. By default, it displays the first 1,000 records in the log data table:
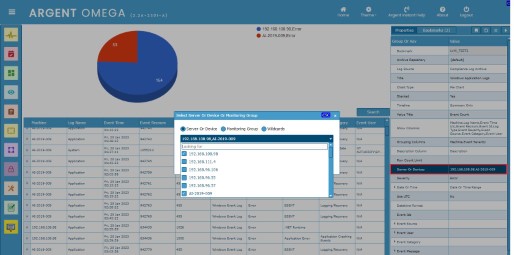
Server Or Devices
Select one or more servers or devices, or one or more Monitoring Groups. Only the event log records of the selected servers or devices will be used in the presentation. Wildcard patterns can also be used for server or device filtering:
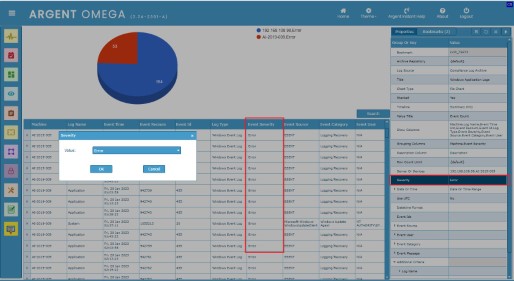
Severity
Select the event’s severity. Only the event log records with the selected severity level are used for the presentation:
Date Or Time
The Date Or Time property specifies the data or time range to collect the event log data. The data within the specified data or time range will be used by the presentation.
Double click on the Date Or Time property to configure the same:
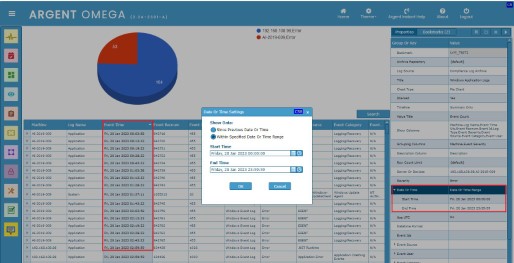
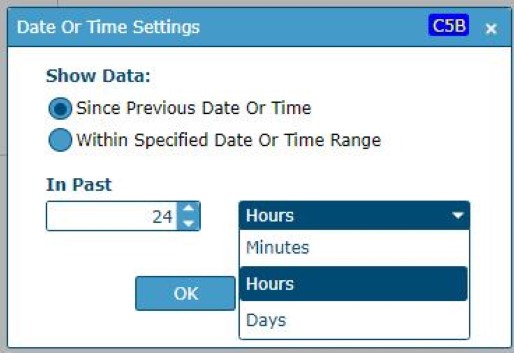
To use the data since a specific number of minutes, hours, or days, use the Since Previous Date Or Time option:
Use UTC
Set the Use UTC property to Yes if the event log record’s Event Time value is taken as UTC time. All date time operations are based on UTC time. Otherwise, event time in an event log record is treated as local time.
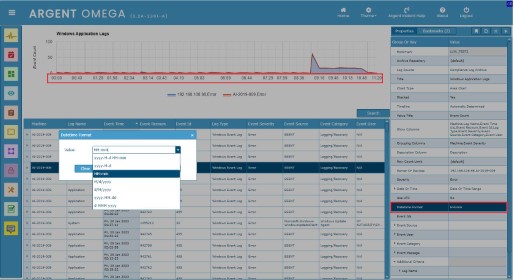
Datetime Format
Choose the required data and time format from the Datetime Format property. The date and time values in the chart will be displayed in the selected format:
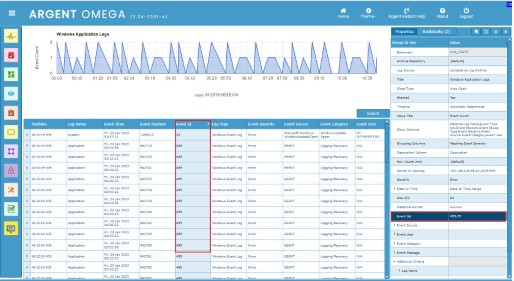
Event Ids
Events with the specified ID’s will be used for the presentation. Use multiple IDs separated by comma:
Filtering Options
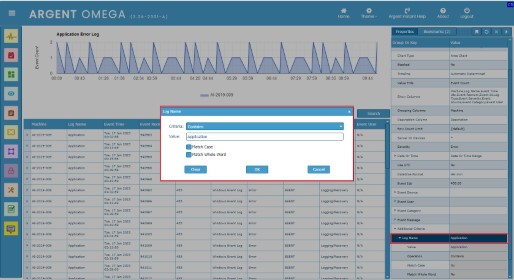
One of the most powerful features of a Log Visualizer is the ability to filter event log records, i.e., to select only those log records that match certain criteria. For example, suppose we want to use only the log records with a specific name or from a specific source, etc. There are options to define criteria for important table columns. These filter options are different across the log sources.
For example, the following filters are available for the log source “Compliance Log Archive”:
Define criteria for one or more columns, double-click the desired filter column property and define the criteria:
The following criteria options are available:
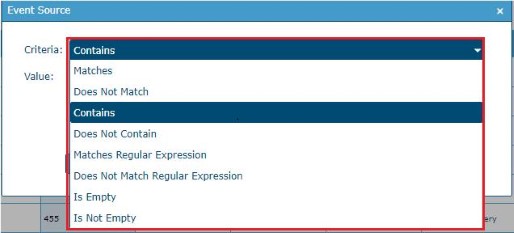
Press the Refresh button after defining the criteria. Only the log records satisfying the specified criteria will be used for the presentation.
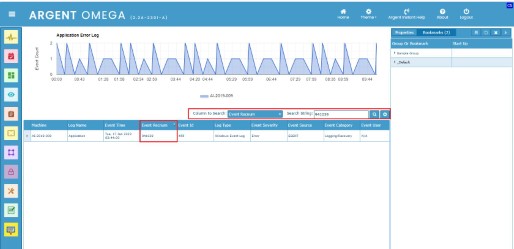
The Search option allows a user to filter the log records in the table by individual columns’ values. This only filters the matching records in the table; it does not affect the charting:
Click the Search button, and then select the column in which the specified text is to be searched:
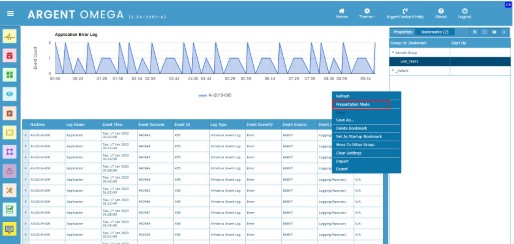
Click the Save context menu option to save the presentation:
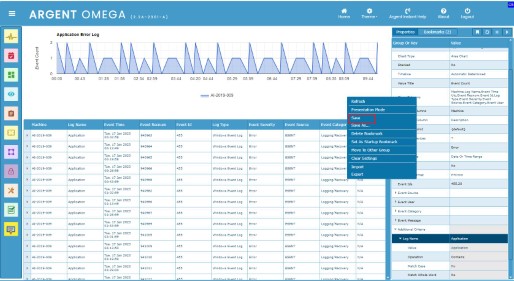
Then specify a unique name and click OK.
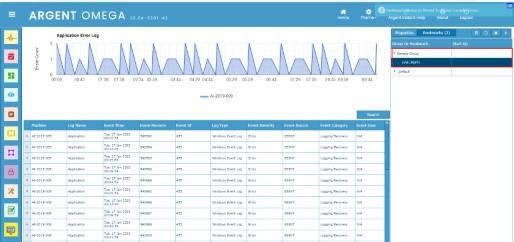
The presentation will be saved as a bookmark. Click on the Bookmarks property tab to see all saved presentations:
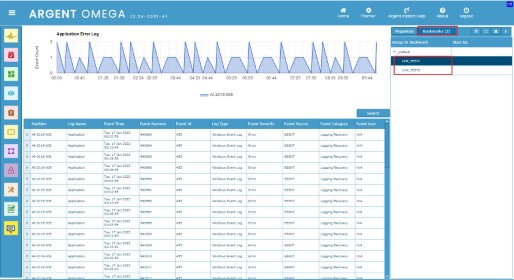
The bookmarks are organized in groups. The newly created dashboards are added to a default group named _Default. Click on the Move To Another Group context menu option to move the current presentation to a new group:
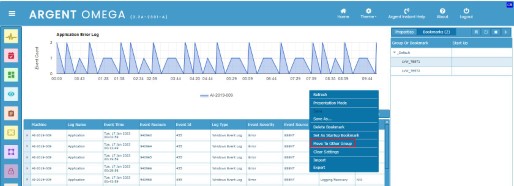
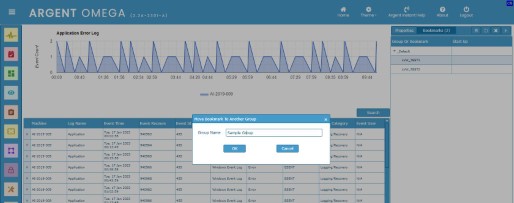
This will create a new group if the group with the specified name does not exist, and the presentation will be moved to the new group:
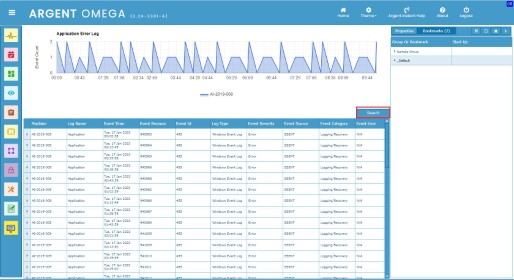
Click on the Presentation Mode context menu option to see the presentation in presentation view.
The following is the presentation view:
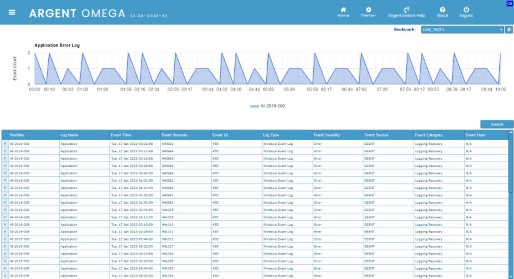
To switch to design mode, click the Design Mode button in the top right context menu option:
Resolution
Upgrade to Argent Omega 2.2A-2301-A or above