Using The Argent Predictor Compression Service
Though Argent Predictor Compression Service is part of Argent Advanced Technology package, it can compress Argent Predictor data for both XT and AT.
Argent Predictor Compression Service accomplishes following two tasks:
- Calculates hourly, daily, monthly and other user-specified-interval aggregated data on the boundary of calendar hour.
XT and AT reporting engine can improve performance significantly by using the aggregated data instead of original data.
- Purge obsolete performance data once every minute.
It relieves XT and AT products from running lengthy SQL deletion query when main engine starts or recycles.
- Optionally archive the purged original data to a secondary archiving table.
Argent Predictor Compression Service uses between 0.5% to 5.0% of CPU usage
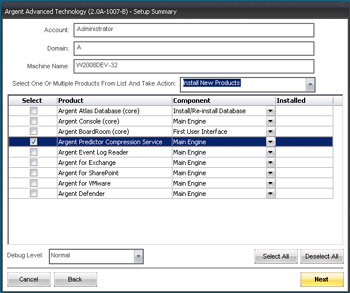
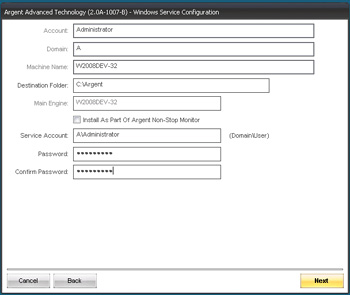
Install Argent Predictor Compression Service
Run setup program of Argent Advanced Technology (2.0A-1007-B or later).
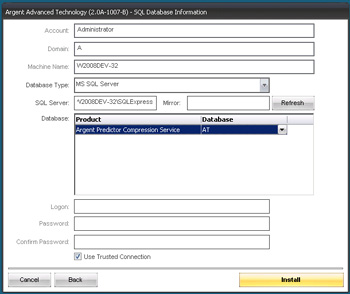
Argent Predictor Compression Service requires SQL backend for its control information.
Argent Predictor Compression Service neither needs to be installed on the XT or AT main engine, nor requires XT or AT client GUI be installed first.
It DOES require access to the registry of XT or AT main engine, and SQL backend used by XT or AT.
Note: Argent Predictor Compression Service can be installed as standalone as it has no dependency on other AT products.
Configure Argent Predictor Compression Service
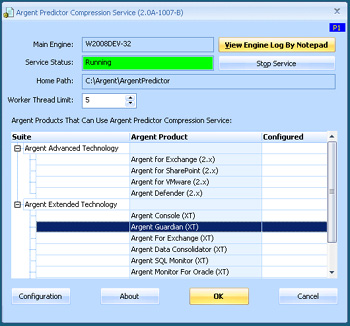
Run Argent Predictor Compression Service GUI by using the shortcut created by setup program.
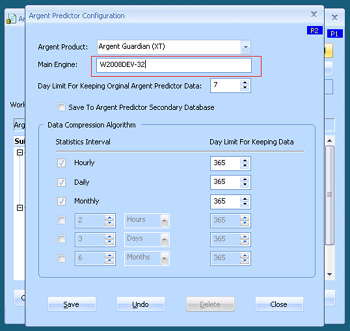
Select the product then click on ‘Configuration’ button or simply double click on the product row.
User can select some or all XT or AT products for Argent Predictor Compression Service to work on.
Besides the hourly, daily and monthly data, user can also specify up to three custom intervals for additional statistics data.
XT and AT Reporting Engine
When Argent Predictor Compression Service is turned on a XT or AT product, following things will happen:
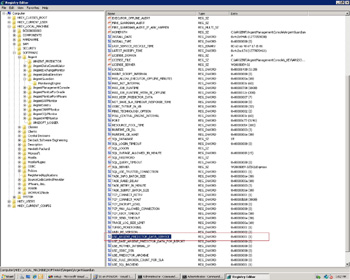
- Registry ‘USE_ARGENT_PREDICTOR_DATA_SERVICE’ is set to be 1.
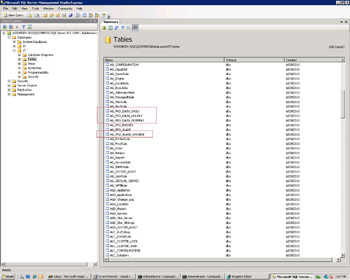
- Hourly, daily and monthly plus custom Argent Predictor data tables are created. The secondary archive table will be generated too if the option is used.
- XT or AT product will SKIP purging Argent Predictor data.
- Argent Predictor Compression Service will populate the new tables and purge/archive original performance data.
XT or AT reporting engine uses the new statistics data intelligently. If the report does not specify explicitly as hourly, daily, weekly or monthly report, use following algorithm.
- If the specified date/time range is more than 365 days, use monthly table (AG_PRD_DATA_MONTHLY).
- If the specified date/time range is more than 28 days, use daily table (AG_PRD_DATA_DAILY)
- If the specified date/time range is more than 24 hours, use hourly table (AG_PRD_DATA_DAILY)
- If the specified date/time range is less than 24 hours, use original table (AG_PRD_SLAVE)
There are some exceptions for the above rules.
- Performance Charting Report. When option ‘Automatic Scale From The First To Last Valid Data Point’ is used, no date/time range is specified, use the original table (AG_PRD_SLAVE)
- Performance Crystal Report. If hourly, daily, weekly or monthly report is explicitly specified, the correspondent data table should be used. For weekly report, daily table is used.
- SLA Up-Down Summary Report always uses the original table.
To turn off the usage of algorithm, set registry
‘USE_BASE_ARGENT_PREDICTOR_DATA_FOR_REPORT’ to 1.
In this case, the original data table (AG_PRD_SLAVE) is ALWAYS used.
Appendix A – SQL Structure
Argent Predictor original data stores in mother and daughter tables. The SQL table structure in AT is as follows:
Mother SQL Table
| Column | Type | Size | Description |
|---|---|---|---|
| UUID | varchar(36) | 4 | Record unique identifier. |
| CREATE_TIME | datetime | 16 | Record creating time |
| MODIFY_TIME | datetime | 16 | Record latest modification time |
| MACHINE | nvarchar | 256 | Machine. |
| OBJECT | nvarchar | 256 | Object. |
| COUNTER | nvarchar | 256 | Counter. |
| INSTANCE | nvarchar | 256 | Instance. |
| AVERVAL | real | 4 | Average of counter metric. |
| MAXVAL | real | 4 | Maximum of counter metric. |
| MINVAL | real | 4 | Minimum of counter metric. |
| LASTVAL | real | 4 | Last counter metric. |
| START_TIME | datetime | 16 | The first snapshot time. |
| END_TIME | datetime | 16 | The last snapshot time. |
| TOT_COUNT | int | 4 | Total snapshots for this counter in the database. |
| OWNER | nvarchar | 256 | Owner |
| CRC_LOW | int | 4 | CRC low DWORD |
| CRC_HIGH | int | 4 | CRC high DWORD |
Daughter SQL Table
| Column | Type | Size | Description |
|---|---|---|---|
| UUID | varchar | 36 | Record unique identifier. |
| MASTER_UUID | varchar | 36 | Mother record UUID |
| METRIC | real | 4 | Metric value |
| SNAP_TIME | datetime | 16 | Snap time |
| MAINTENANCE | Int | 4 | Boolean value identifying if snapshot was taken while node is in maintenance mode |
The compressed data is to be stored in three separate SQL tables for hourly, daily and monthly statistics respectively. The table names are as follows:
- ARGSOFT_{product}_PRD_DATA_HOURLY
- ARGSOFT_{product}_PRD_DATA_DAILY
- ARGSOFT_{product}_PRD_DATA_MONTHLY
The tables have the same structure, and sharing the same MOTHER table with DAUGHTER table.
| Column | Type | Size | Description |
|---|---|---|---|
| UUID | varchar | 36 | Record unique identifier. |
| MASTER_UUID | varchar | 36 | Mother record UUID |
| SNAP_TIME | datetime | 16 | Snap time |
| AVERVAL | real | 4 | Average over the time period |
| MAXVAL | real | 4 | Maximum value |
| MINVAL | real | 4 | Minimum value |
